Unlock a world of possibilities! Login now and discover the exclusive benefits awaiting you.
- Qlik Community
- :
- All Forums
- :
- QlikView App Dev
- :
- Display Null values
- Subscribe to RSS Feed
- Mark Topic as New
- Mark Topic as Read
- Float this Topic for Current User
- Bookmark
- Subscribe
- Mute
- Printer Friendly Page
- Mark as New
- Bookmark
- Subscribe
- Mute
- Subscribe to RSS Feed
- Permalink
- Report Inappropriate Content
Display Null values
Hi All,
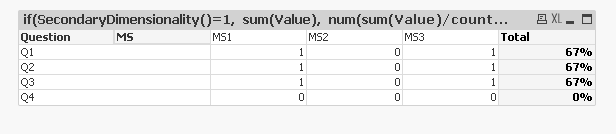
I am trying to display the values in pivot table. it is not displaying the rows with value null.
As per below is the script for Q4 column the values are empty. Pivot table is not displaying Q4.
I need to display even though it is null
Script:
CrossTable(Question,Value,3)
LOAD MS, DELAER, COUNTRY, Q1, Q2, Q3, Q4 INLINE [
Q1, Q2, Q3, Q4, MS, DELAER, COUNTRY
1, 1, 1, , MS1, ,
0, 0, , , MS2, ,
1, 1, 1,, MS3];
Pivot table
Expression
if(SecondaryDimensionality()=1, sum(Value), num(sum(Value)/count(Value),'0%') )
Thanks,
Selva
- Mark as New
- Bookmark
- Subscribe
- Mute
- Subscribe to RSS Feed
- Permalink
- Report Inappropriate Content
You want to display the Q4 rite?
Just Goto Properties-> Presentation -> Uncheck the supress zero values
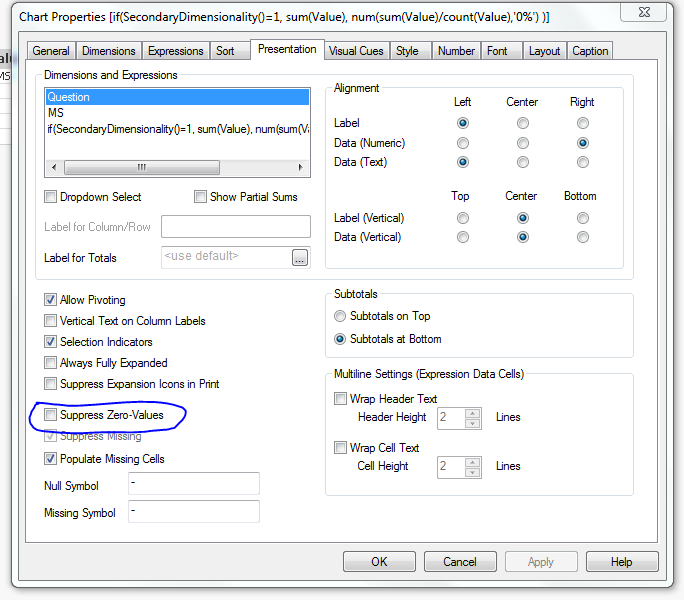
Thanks
- Mark as New
- Bookmark
- Subscribe
- Mute
- Subscribe to RSS Feed
- Permalink
- Report Inappropriate Content
Hi Parthipan,
Thanks for your efforts.
In the expression i am trying to display 'Yes' if value=1 and 'No' if value=0 and 'N/A' if value=null
if ( SecondaryDimensionality()=1 ,
if ( sum(Alt(Value,0)) = 1 , Dual('Yes',1) , if ( sum(Alt(Value,0)) = 0 , Dual('No',0) , sum(Alt(Value,0)))) ,
num(sum ({<Question={'Q1','Q2','Q3','Q4','Q5','Q6','Q7A','Q7B','Q8','Q9','Q10','Q11','Q12','Q13'}>}Alt(Value,0))/
count ({<Question={'Q1','Q2','Q3','Q4','Q5','Q6','Q7A','Q7B','Q8','Q9','Q10','Q11','Q12','Q13'}>} Value ),'0%' ))
then is is not displaying rows with null or empty.
how to check for null value in expression, i tried isnull and len(value)=0. No luck
Thanks,
Selva
- Mark as New
- Bookmark
- Subscribe
- Mute
- Subscribe to RSS Feed
- Permalink
- Report Inappropriate Content
Selva,
We usually use
if( Len(Trim(Field))=0, 'Null()',1)
to find out the null values.
Trim() is always important in finding the null or empty values.
Please let me know, if it works.
Thanks,
- Mark as New
- Bookmark
- Subscribe
- Mute
- Subscribe to RSS Feed
- Permalink
- Report Inappropriate Content
Hi Parthiban,
I am using the below expression
if ( SecondaryDimensionality()=1 ,
if ( sum(Alt(Value,0)) = 1 , Dual('Yes',1) , if ( sum(Alt(Value,0)) = 0 , Dual('No',0) , sum(Alt(Value,0)))) ,
num(sum ({<Questions={'Q1','Q2','Q3','Q4','Q5','Q6','Q7A','Q7B','Q8','Q9','Q10','Q11','Q12','Q13'},WAVE={'WAVE2'}>}Alt(Value,0))/
count ({<Questions={'Q1','Q2','Q3','Q4','Q5','Q6','Q7A','Q7B','Q8','Q9','Q10','Q11','Q12','Q13'},WAVE={'WAVE2'}>} Value ),'0%' ))
i have values 1,0,null in my DB for columns Q1M,Q2,Q3...Q13. I need to display if value =1 then Yes, if value =0 then No and if value=null then N/A.
I cannot do this in script since calculation is involved.
Below is my script:
Crosstable(Questions, Value,4)
SQL Select MYSTERY_SHOPPER, DEALER, COUNTRY, WAVE, Q1, Q2, Q3, Q4, Q5,Q6,Q7A,Q7B,Q8,Q9,Q10,Q11,Q12,Q13,
Q14,Q15A,Q15B,Q15C,Q15D,Q15F,Q15G,Q15H,Q15I,Q16,Q17,Q18,Q19,Q20,Q21,
Q22,Q23,Q24,Q25,Q26,Q27,Q28,Q29,Q30,Q31,Q32_A ,Q32_B,Q32_C,Q32_D,Q33,Q34,Q35,Q36,Q37,Q38,Q39,Q40,Q41,Q42,Q43,Q44,Q45,
Q46,Q47,Q48,Q49,Q50,Q51,Q52,Q53,Q54
From XX_JLR_SALES_DATA_ENTRY_NEW WHERE ENABLED='YES';
Pivot table Dimension :
Questions
Mystery_Shopper
In Chart properties -> Presentation -> Uncheck "Supress Zero-Values"
For example for Q9,
Mystery_Shopper1=1
Mystery_Shopper1=0
Mystery_Shopper1=Null
Then pivot table display
Yes, No, N/A
Mystery_Shopper1=Null
Mystery_Shopper1=Null
Mystery_Shopper1=Null
As above if all the values are null, Then pivot table is not displaying Q9.
This is the issue i am facing.
Thanks,
Selva