Unlock a world of possibilities! Login now and discover the exclusive benefits awaiting you.
- Qlik Community
- :
- All Forums
- :
- QlikView
- :
- Display Time as per "Region" Filter
- Subscribe to RSS Feed
- Mark Topic as New
- Mark Topic as Read
- Float this Topic for Current User
- Bookmark
- Subscribe
- Mute
- Printer Friendly Page
- Mark as New
- Bookmark
- Subscribe
- Mute
- Subscribe to RSS Feed
- Permalink
- Report Inappropriate Content
Display Time as per "Region" Filter
Hi All,
I have created a line chart for my data - Email Responses by time of the day.
I have a filter "Contact Theater" which has values "APAC", "EMEA", "NA". The below chart displays data when I select "NA" as a filter. The time bucket information is in EST time zone.
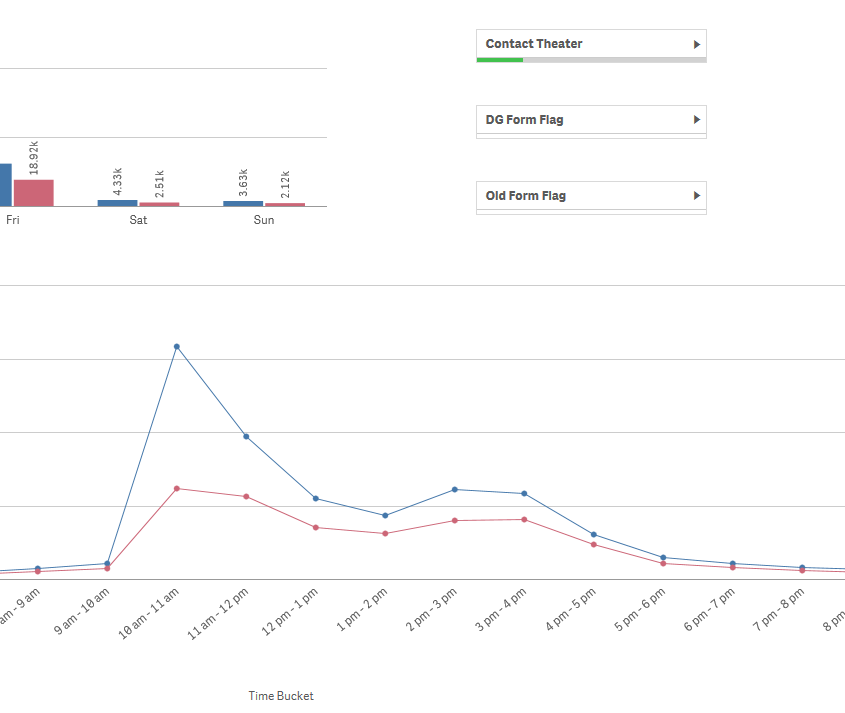
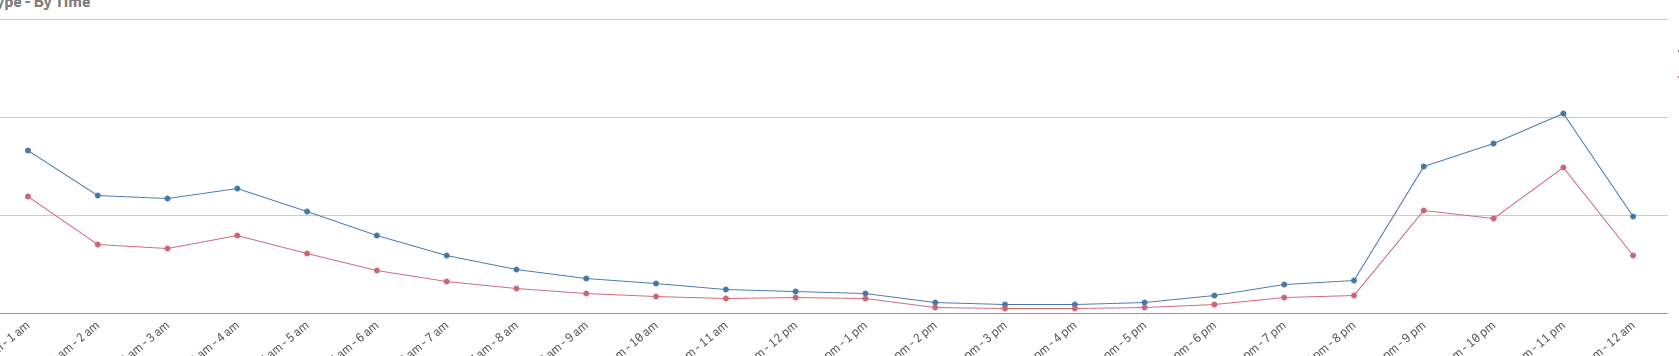
I need to display the Time bucket data when I select a Region -> APAC or EMEA . My current issue is when I select APAC Region. It displays the time is GMT. If you see the below chart the email responses are highest at 10:00 PM-11:00 PM and also at 1:00 AM - 02:00 AM. I am guessing the time zone isn't changing when I select the APAC region. Can you please help?
- Mark as New
- Bookmark
- Subscribe
- Mute
- Subscribe to RSS Feed
- Permalink
- Report Inappropriate Content
Can you have a look this
- Mark as New
- Bookmark
- Subscribe
- Mute
- Subscribe to RSS Feed
- Permalink
- Report Inappropriate Content
Thank you Anil for Sharing the Link. However I have already created the TimeBucket field in my load script. I just need to know when I select a different region I need to see the time data of that selected Region. In my second chart where I select the APAC region it gives me the data at odd times like 1:00 AM - 02:00 AM or 10:00 PM -11:00 PM.
- Mark as New
- Bookmark
- Subscribe
- Mute
- Subscribe to RSS Feed
- Permalink
- Report Inappropriate Content
please post a sample application to demonstrate this issue
- Mark as New
- Bookmark
- Subscribe
- Mute
- Subscribe to RSS Feed
- Permalink
- Report Inappropriate Content
Seems you are working QS. Would you shre sample qvf file
- Mark as New
- Bookmark
- Subscribe
- Mute
- Subscribe to RSS Feed
- Permalink
- Report Inappropriate Content
Hi Marco,
Attached is sample app. What I am looking for is the data should change on user selection of a region filter.
Eg: If the user selects APAC region the chart should change the data as per APAC time. What I am looking for is when Email Open rates are highest.