Unlock a world of possibilities! Login now and discover the exclusive benefits awaiting you.
- Qlik Community
- :
- All Forums
- :
- QlikView App Dev
- :
- Display all dimension values
- Subscribe to RSS Feed
- Mark Topic as New
- Mark Topic as Read
- Float this Topic for Current User
- Bookmark
- Subscribe
- Mute
- Printer Friendly Page
- Mark as New
- Bookmark
- Subscribe
- Mute
- Subscribe to RSS Feed
- Permalink
- Report Inappropriate Content
Display all dimension values
Hi all,
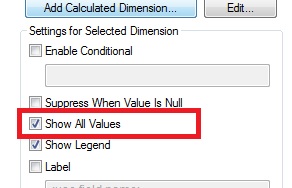
I want display all my dimension values in X axis of a graph. I check the option "Display all value" but it doesn't works.
And i don't want use a scrolling bar chart.
Any idea?
Accepted Solutions
- Mark as New
- Bookmark
- Subscribe
- Mute
- Subscribe to RSS Feed
- Permalink
- Report Inappropriate Content
Hi, thanks for your answers. So, i solved the problem.
I was unable to check "Show all bars" in presentation tab because my graph is a line chart.
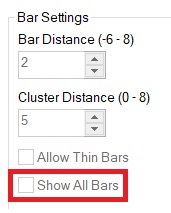
I changed my line chart in bar chart. The "Show all bars" became active, i checked it and transform line in bar chart.
- Mark as New
- Bookmark
- Subscribe
- Mute
- Subscribe to RSS Feed
- Permalink
- Report Inappropriate Content
No one thing you can do is increase the size of chart.
- Mark as New
- Bookmark
- Subscribe
- Mute
- Subscribe to RSS Feed
- Permalink
- Report Inappropriate Content
Try this
Add Sum({1}0) in your expression
ex-Expression + Sum({1}0)
Regards
Raman
- Mark as New
- Bookmark
- Subscribe
- Mute
- Subscribe to RSS Feed
- Permalink
- Report Inappropriate Content
Hi, thanks for your answers. So, i solved the problem.
I was unable to check "Show all bars" in presentation tab because my graph is a line chart.
I changed my line chart in bar chart. The "Show all bars" became active, i checked it and transform line in bar chart.