Unlock a world of possibilities! Login now and discover the exclusive benefits awaiting you.
- Qlik Community
- :
- All Forums
- :
- QlikView App Dev
- :
- Display values of the x-Axis different than the va...
- Subscribe to RSS Feed
- Mark Topic as New
- Mark Topic as Read
- Float this Topic for Current User
- Bookmark
- Subscribe
- Mute
- Printer Friendly Page
- Mark as New
- Bookmark
- Subscribe
- Mute
- Subscribe to RSS Feed
- Permalink
- Report Inappropriate Content
Display values of the x-Axis different than the values for calculation
Hello,
we are currently programming a Kaplan-Meier curve.
It woks as the following:
It has a Dimension (timesale) defining the x-axis and several functions defining the y-axis.
The y-axis is fine.
The x-axis though creates problems.
If we for instance use "days" as the x axis, for every single day the formulars are calculated, resulting in run time problems.
Month are ok - but we would like to have a more dynamic approach.
Our idea is that the x-axis is always calculated based on 100 data points. This DOES work!
(see screenshot)
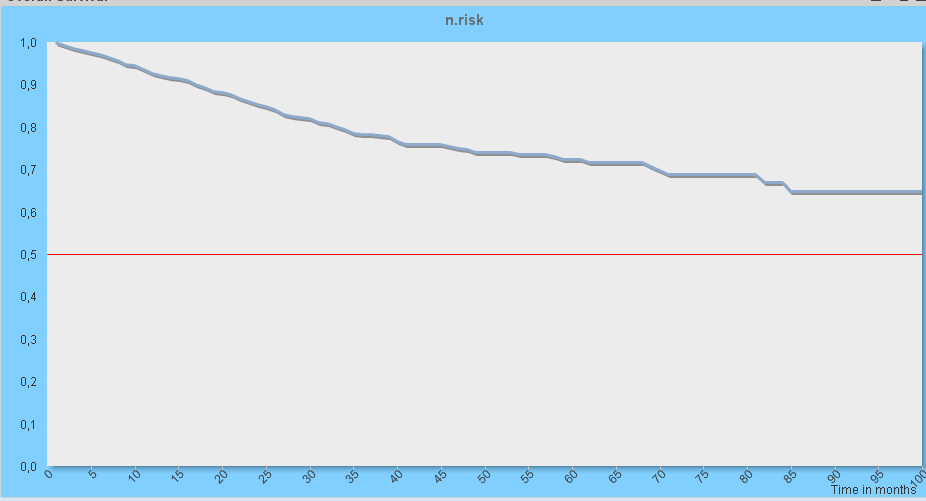
Now the problem is, that the display of the x-axis is not correct. It is based on a timescale split to 100 data points. But! The real data points e.g. in terms of month is more. Hence, we would like to keep the 100 points for calculating the y-formula but exchange the x-axis text with the corresponging values of e.g. month or days or years. (see screenshot)
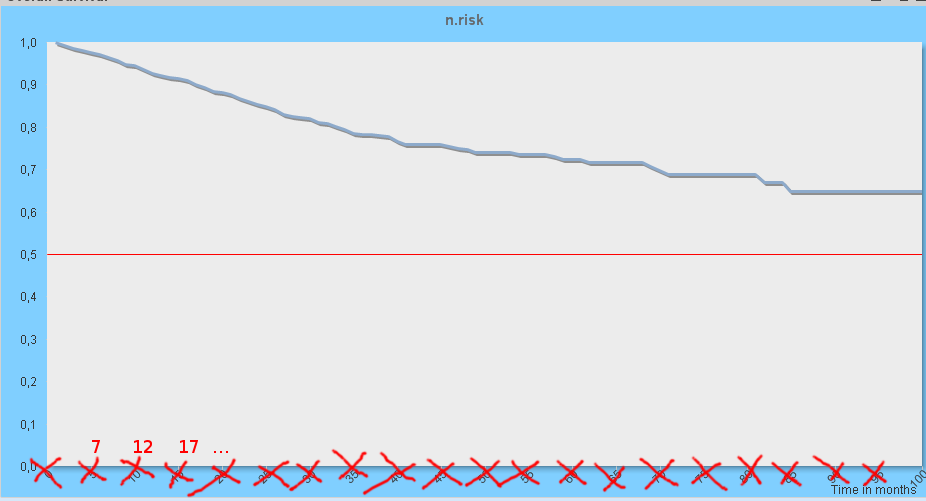
Hopefully the problem is kinda understandable. We know how to set days for the x-axis, but like said this results in a lot of runtime problems. Just need to exchange the texts.