Unlock a world of possibilities! Login now and discover the exclusive benefits awaiting you.
- Qlik Community
- :
- All Forums
- :
- QlikView App Dev
- :
- Displaying a value from a single row of a chart
- Subscribe to RSS Feed
- Mark Topic as New
- Mark Topic as Read
- Float this Topic for Current User
- Bookmark
- Subscribe
- Mute
- Printer Friendly Page
- Mark as New
- Bookmark
- Subscribe
- Mute
- Subscribe to RSS Feed
- Permalink
- Report Inappropriate Content
Displaying a value from a single row of a chart
I have a chart with a "Number of Days to Close" dimension, and a "Running Percent" calculated expression:
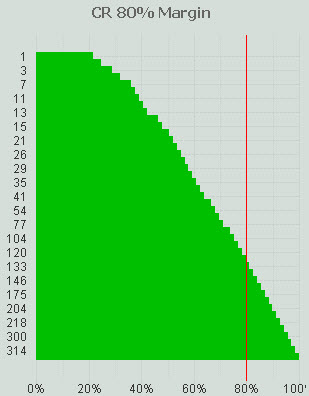
Here is a straight table representation:
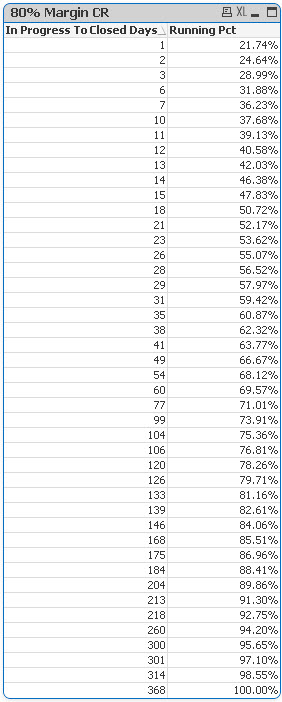
Essentially what this tells the user is how many days it takes for 80% of Change Requests to close. In addition to the visual chart, I would like to display this single number separately; either using text in the chart, or a separate text object. I need to call out the dimention value (number of days) where the running percent is 80%. In the above example this would be 133.
When I try to add the expression below as "Text in Chart" on the presentation tab, it doesn't work, I'm guessing because I can't reference the calculated expression [Running Pct]:
=min({$<[Running Pct]={">=.8"} >} [CR In Progress To Closed Days])
Any ideas on how this could be done?
I added a reference line to show where the 80% value would be, which allows the user to hover over and see the value, but I would like this to be explicitly shown as well.
- Mark as New
- Bookmark
- Subscribe
- Mute
- Subscribe to RSS Feed
- Permalink
- Report Inappropriate Content
No, I don't think you can reference your expression values like this outside the chart.
I believe your problem is quite similar to Eva's that we discussed here:
http://community.qlik.com/message/225318
So I think your issue might be solved with something like
=min(aggr(if( rangesum( above(YOUREXPRESSION,0,rowno()))>.80,Dimension),Dimension))
(please check out my comment on the requirements for an appropriately ordered dimension)