Unlock a world of possibilities! Login now and discover the exclusive benefits awaiting you.
- Qlik Community
- :
- All Forums
- :
- QlikView App Dev
- :
- Displaying dimension values in a chart when there ...
- Subscribe to RSS Feed
- Mark Topic as New
- Mark Topic as Read
- Float this Topic for Current User
- Bookmark
- Subscribe
- Mute
- Printer Friendly Page
- Mark as New
- Bookmark
- Subscribe
- Mute
- Subscribe to RSS Feed
- Permalink
- Report Inappropriate Content
Displaying dimension values in a chart when there are no records for the expression to calculate
I have two customers, one of which has some purchase and sales transactions and one which doesn't.
I would like to create a chart which sums the purchase and sales totals for each client AND displays both clients, even though one will not have any transactions to sum.
Many thanks in advance for any suggestions
- Tags:
- new_to_qlikview
- « Previous Replies
-
- 1
- 2
- Next Replies »
Accepted Solutions
- Mark as New
- Bookmark
- Subscribe
- Mute
- Subscribe to RSS Feed
- Permalink
- Report Inappropriate Content
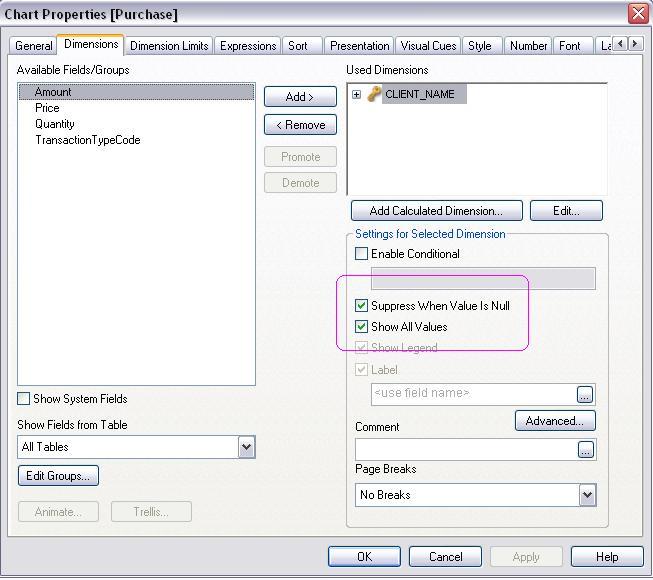
Create a Straight Table
Dimension = CLIENT_NAME
Tick Suppress When Value is NULL
Tick Show All Values
Expressions
Purchase : SUM({<TransactionTypeCode = {'P'}>}Quantity)
Sales : SUM({<TransactionTypeCode = {'S'}>}Quantity)
Purchase Total Value : SUM({<TransactionTypeCode = {'P'}>}Amount)
Sales Total Value : SUM({<TransactionTypeCode = {'S'}>}Amount)
- Mark as New
- Bookmark
- Subscribe
- Mute
- Subscribe to RSS Feed
- Permalink
- Report Inappropriate Content
Like This?
- Mark as New
- Bookmark
- Subscribe
- Mute
- Subscribe to RSS Feed
- Permalink
- Report Inappropriate Content
Hi Manish,
Thanks for the quick response - unfortunately I've only got the personal edition so can't open your test qvw - Could you let me know what the fix is and I'll give it a go.
many thanks
john
- Mark as New
- Bookmark
- Subscribe
- Mute
- Subscribe to RSS Feed
- Permalink
- Report Inappropriate Content
If you want to display zero-values go to the presentation tab on the object and uncheck "Suppress zero values."
- Mark as New
- Bookmark
- Subscribe
- Mute
- Subscribe to RSS Feed
- Permalink
- Report Inappropriate Content
Go to presentation tab and untick suppress zero
- Mark as New
- Bookmark
- Subscribe
- Mute
- Subscribe to RSS Feed
- Permalink
- Report Inappropriate Content
Hi Christian
Unchecking the suppress zero values didn't work; I guess because there aren't any values in there at all?
- Mark as New
- Bookmark
- Subscribe
- Mute
- Subscribe to RSS Feed
- Permalink
- Report Inappropriate Content
Hi john,
You can achieve this by un check Supress zero value option in presentation tab.
Please appreciate our Qlik community members by giving Kudos for sharing their time for your query. If your query is answered, please mark the topic as resolved 🙂
- Mark as New
- Bookmark
- Subscribe
- Mute
- Subscribe to RSS Feed
- Permalink
- Report Inappropriate Content
I'd say try unchecking suppress missing on the presentation tab and then try unchecking suppress nulls on the dimensions tab.
- Mark as New
- Bookmark
- Subscribe
- Mute
- Subscribe to RSS Feed
- Permalink
- Report Inappropriate Content
Create a document by adding below in your script.
Load * Inline
[
Customer, Purchase, Sales
A, 100, 200
B, 120, 240
C, ,
];
Now Create a Line Chart or Bar Chart..
Dimension = Customer
Expression = SUM(Purchase) + SUM(Sales)
Now Go to Presentation tab and untick Supress Zero Values...
Hope this helps...
- Mark as New
- Bookmark
- Subscribe
- Mute
- Subscribe to RSS Feed
- Permalink
- Report Inappropriate Content
Thanks - I'll give it a try and let you know
- « Previous Replies
-
- 1
- 2
- Next Replies »