Unlock a world of possibilities! Login now and discover the exclusive benefits awaiting you.
- Qlik Community
- :
- All Forums
- :
- QlikView App Dev
- :
- Displaying multiple lines of non-connected tables
- Subscribe to RSS Feed
- Mark Topic as New
- Mark Topic as Read
- Float this Topic for Current User
- Bookmark
- Subscribe
- Mute
- Printer Friendly Page
- Mark as New
- Bookmark
- Subscribe
- Mute
- Subscribe to RSS Feed
- Permalink
- Report Inappropriate Content
Displaying multiple lines of non-connected tables
Hello everyone,
i have once again a new problem.
I have 2 tables - each with a field and vales. Something like the following:
Table 1 - Field 1: [99,88,22,103]
Table 2 - Field 2: [33,88,33,111]
Now if i create a diagram and pick Field1 as a dimension. Then for formulas i just write down: Field1.
Then it shows a simple line with 4 nodes (99,88,22,103). So far so good! That is what i want.
Now i would like to have a second line.
And the nodes of the lines should be on the same x-value (1,2,3,4).
Now my idea was to do the following:
Write a loop (pseudocode):
for(int i = 0; i<Field 1.size(); i++)
Pick(i,Field2)
end
Ok - this actually does not work :-). And i have no clue how to combine those 2 lines of non-connected tables.
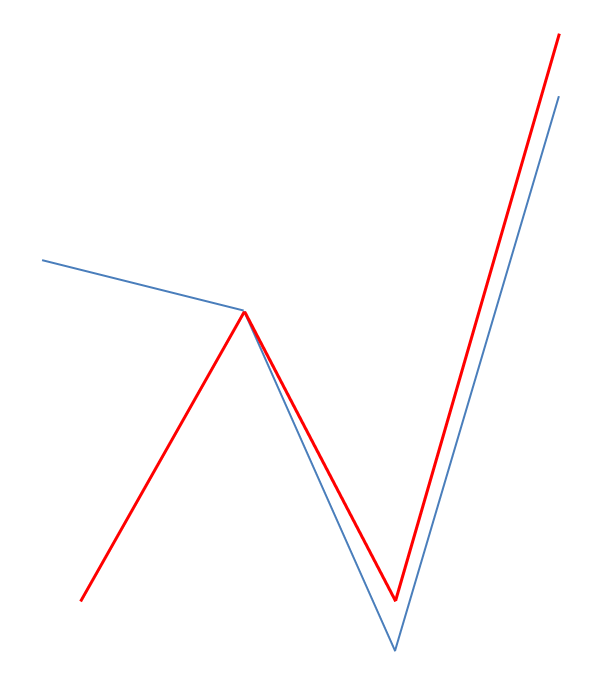
So if there exists confusion about what i would like to have - i post a little MS-paint visualisation (see below => that is the result i would like to gain)