Unlock a world of possibilities! Login now and discover the exclusive benefits awaiting you.
- Qlik Community
- :
- All Forums
- :
- QlikView App Dev
- :
- Distinct Flag
- Subscribe to RSS Feed
- Mark Topic as New
- Mark Topic as Read
- Float this Topic for Current User
- Bookmark
- Subscribe
- Mute
- Printer Friendly Page
- Mark as New
- Bookmark
- Subscribe
- Mute
- Subscribe to RSS Feed
- Permalink
- Report Inappropriate Content
Distinct Flag
Hi,
I have data below,
region Customer Color Blue Flag Car
South 123 YES 1
South 123 YES 1
South 123 YES 1
South 345 No 1
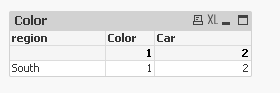
I want this chart to be displayed as below
Region Color blue Car
South 1 2
How can i make expressions doing so? I have count(distinct Car) for the third column but am struggling with the second since the flag is 'Yes' I would like to try to use set analysis if possible.
THanks,
- Mark as New
- Bookmark
- Subscribe
- Mute
- Subscribe to RSS Feed
- Permalink
- Report Inappropriate Content
Assuming you want the count of only Blue Color Car Count, below expression may help.
Count({<[Color Blue Flag] ={"YES"} >} Car)
- Mark as New
- Bookmark
- Subscribe
- Mute
- Subscribe to RSS Feed
- Permalink
- Report Inappropriate Content
Try this?
Add a straight table
Dim: region
Expr1: = Sum( Aggr(Count(DISTINCT Car), region, Customer))
Expr:2 = Count(DISTINCT {< ColorBlue = {'Yes'} >} ColorBlue)
//Expr2: = Only({< ColorBlue = {'Yes'} >} ColorBlue)
- Mark as New
- Bookmark
- Subscribe
- Mute
- Subscribe to RSS Feed
- Permalink
- Report Inappropriate Content
I am sorry, the last column is supposed to be customer, not car.
- Mark as New
- Bookmark
- Subscribe
- Mute
- Subscribe to RSS Feed
- Permalink
- Report Inappropriate Content
Just use like
= Count(Distinct Customer)