Unlock a world of possibilities! Login now and discover the exclusive benefits awaiting you.
- Qlik Community
- :
- All Forums
- :
- QlikView App Dev
- :
- Distribute grouped values for periods of daily val...
- Subscribe to RSS Feed
- Mark Topic as New
- Mark Topic as Read
- Float this Topic for Current User
- Bookmark
- Subscribe
- Mute
- Printer Friendly Page
- Mark as New
- Bookmark
- Subscribe
- Mute
- Subscribe to RSS Feed
- Permalink
- Report Inappropriate Content
Distribute grouped values for periods of daily values
Hello everyone, I need your help to spread the values that are part of a range of dates, to daily values.
Enclosed is an example of what I'd need.
my data source is a single file QVD with the fields as in the Excel.
To consider that my total assets are about 450.
Thanks to those who can help me
- « Previous Replies
-
- 1
- 2
- Next Replies »
Accepted Solutions
- Mark as New
- Bookmark
- Subscribe
- Mute
- Subscribe to RSS Feed
- Permalink
- Report Inappropriate Content
Try this:
Table:
LOAD asset,
Date(Floor(data)) as date,
delta
FROM
[targhe2.xlsx]
(ooxml, embedded labels, table is Sheet1);
tmpTable:
LOAD *
Where Not(delta = 0 and Flag > 1);
LOAD *,
AutoNumber(RecNo(), asset) as Flag,
Date(If(asset = previous(asset), Peek('date') + 1, date)) as startdate
Resident Table
Order By asset, date;
FinalTable:
LOAD Date(startdate + IterNo() - 1) as date,
delta/(date - startdate + 1) as value,
asset
Resident tmpTable
While startdate + IterNo()-1 <= date;
DROP Tables Table, tmpTable;
- Mark as New
- Bookmark
- Subscribe
- Mute
- Subscribe to RSS Feed
- Permalink
- Report Inappropriate Content
These belong to different id... the final output will only have the three columns you have specified?? or those will repeat just like repeating value??
- Mark as New
- Bookmark
- Subscribe
- Mute
- Subscribe to RSS Feed
- Permalink
- Report Inappropriate Content
I need a new QVD with three fields.
- Mark as New
- Bookmark
- Subscribe
- Mute
- Subscribe to RSS Feed
- Permalink
- Report Inappropriate Content
Try this
Table:
LOAD asset,
date,
avg
FROM
[..\..\..\Downloads\targhe1.xlsx]
(ooxml, embedded labels, table is Foglio1);
tmpTable:
LOAD *,
Date(If(asset = previous(asset), Peek('date') + 1, date)) as startdate
Resident Table;
FinalTable:
LOAD Date(startdate + IterNo() - 1) as date,
avg as value,
asset
Resident tmpTable
While startdate + IterNo()-1 <= date;
DROP Tables Table, tmpTable;
- Mark as New
- Bookmark
- Subscribe
- Mute
- Subscribe to RSS Feed
- Permalink
- Report Inappropriate Content
the final work is definitely what you need me. Unfortunately  I was a bit inaccurate to ask the question because the avg field is not present in the original QVD but should first be averaged and then should apply your current processing
- Mark as New
- Bookmark
- Subscribe
- Mute
- Subscribe to RSS Feed
- Permalink
- Report Inappropriate Content
What are we averaging? How does the raw data look like?
- Mark as New
- Bookmark
- Subscribe
- Mute
- Subscribe to RSS Feed
- Permalink
- Report Inappropriate Content
- To group together assets;
- Ordered by date;
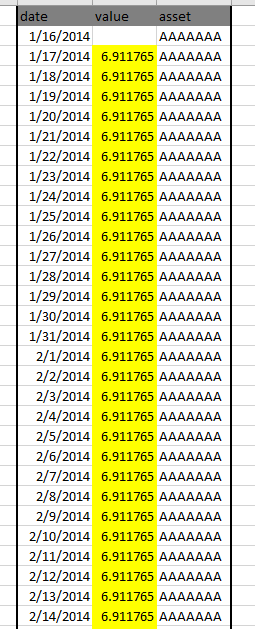
- The average (avg) is given from the delta area, divided by the difference in days between the date referred to by the value and the previous date.
| id | asset | location | metername | delta | date | avg | mode calculating avg |
| 292085 | AAAAAAA | AUTOPARCO | CHILOMETRI | 0 | 16/01/2014 | null | delta (0) / null _________ (16/01/2014 - null) |
| 293766 | AAAAAAA | AUTOPARCO | CHILOMETRI | 235 | 19/02/2014 | 6.911765 | delta (235) / 34 ___________(19/02/2014 - 16/01/2014) |
| 294590 | AAAAAAA | AUTOPARCO | CHILOMETRI | 284 | 07/03/2014 | 17.75 | delta (284) /16________ (07/03/2014 - 19/02/2014) |
| 294669 | AAAAAAA | AUTOPARCO | CHILOMETRI | 51 | 10/03/2014 | 17 | delta (51) /3_______ (10/03/2014 - 07/03/2014) |
- Mark as New
- Bookmark
- Subscribe
- Mute
- Subscribe to RSS Feed
- Permalink
- Report Inappropriate Content
Try this:
Table:
LOAD asset,
date,
delta
FROM
[..\..\..\Downloads\targhe1.xlsx]
(ooxml, embedded labels, table is Foglio1);
tmpTable:
LOAD *,
Date(If(asset = previous(asset), Peek('date') + 1, date)) as startdate
Resident Table;
FinalTable:
LOAD Date(startdate + IterNo() - 1) as date,
delta/(date - startdate + 1) as value,
asset
Resident tmpTable
While startdate + IterNo()-1 <= date;
DROP Tables Table, tmpTable;
- Mark as New
- Bookmark
- Subscribe
- Mute
- Subscribe to RSS Feed
- Permalink
- Report Inappropriate Content
I take advantage of your kindness .... 
The drawing is fine if the asset field I only have a unique value, but I have problems when loading a source (as attached) with many different assets. Or rather, if I high daily values do not coincide with grouped delta.
In your opinion, you can delete the lines that have to be calculating delta zero?
- Mark as New
- Bookmark
- Subscribe
- Mute
- Subscribe to RSS Feed
- Permalink
- Report Inappropriate Content
Not sure I understand this:
In your opinion, you can delete the lines that have to be calculating delta zero?
Can you check if this works?
Table:
LOAD asset,
Date(Floor(data)) as date,
delta
FROM
[targhe2.xlsx]
(ooxml, embedded labels, table is Sheet1);
tmpTable:
LOAD *,
Date(If(asset = previous(asset), Peek('date') + 1, date)) as startdate
Resident Table
Order By asset, date;
FinalTable:
LOAD Date(startdate + IterNo() - 1) as date,
delta/(date - startdate + 1) as value,
asset
Resident tmpTable
While startdate + IterNo()-1 <= date;
DROP Tables Table, tmpTable;
- « Previous Replies
-
- 1
- 2
- Next Replies »