Unlock a world of possibilities! Login now and discover the exclusive benefits awaiting you.
- Qlik Community
- :
- All Forums
- :
- QlikView App Dev
- :
- Distribution of specific % of value and add it to ...
Options
- Subscribe to RSS Feed
- Mark Topic as New
- Mark Topic as Read
- Float this Topic for Current User
- Bookmark
- Subscribe
- Mute
- Printer Friendly Page
Turn on suggestions
Auto-suggest helps you quickly narrow down your search results by suggesting possible matches as you type.
Showing results for
Specialist III
2016-11-22
04:53 AM
- Mark as New
- Bookmark
- Subscribe
- Mute
- Subscribe to RSS Feed
- Permalink
- Report Inappropriate Content
Distribution of specific % of value and add it to specific value
Hi Friends ,
I have a situtation , see below data
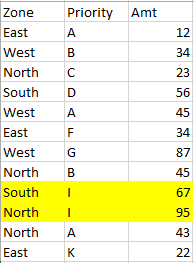
I dont want to show I priority in my dashboard , but value of I should be distribute like below
41% of I should add to A
59% of I should add to B
and for other dimensions like zone or some others , it should not happen , and i want to make pivot table for that .
How can i approach this solution.
Attaching sample data
492 Views
0 Replies