Unlock a world of possibilities! Login now and discover the exclusive benefits awaiting you.
- Qlik Community
- :
- All Forums
- :
- QlikView App Dev
- :
- Dynamic Euclidean Distance in QlikView
- Subscribe to RSS Feed
- Mark Topic as New
- Mark Topic as Read
- Float this Topic for Current User
- Bookmark
- Subscribe
- Mute
- Printer Friendly Page
- Mark as New
- Bookmark
- Subscribe
- Mute
- Subscribe to RSS Feed
- Permalink
- Report Inappropriate Content
Dynamic Euclidean Distance in QlikView
Hi Guys,
Tricky one here. I've been trying to work out how I can calculate the top 10 Companies based on their euclidean distances from a selected company. This distance is calculated from certain Attributes (38 of them) and there are ~200 companies in question. It is tricky because the top 10 companies need to change dependent on which company is in question, and the user can also pick and choose which attributes they want this ranking to be based upon. Due to the sheer number of permeations, I don't think it really feasible to have a huge table in the back end that would gives the top 10 for each option.
For those that might not know, the euclidean distance is calculated as (from wiki):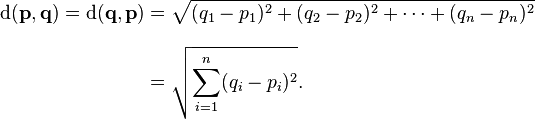
I've been toying with the idea of using R to compute the euclidean distances for all the companies and return a result, but as this will be used on the server, I've found the success of macro's to be very unreliable and so I'm steering away from this option unless someone knows how I can execute either a macro or a batch file from within the browser (without Publisher)?? Other things to think about is any output from R would need to be reloaded back into the data model which I understand is not possible from within the browser (?) and anyhow this could cause issues if two users are trying to show the top 10 at the same time.
I can fairly easily produce a front end table showing the top 10 based on selections but really what I need is to have the top 10 as a dimension so I can filter other charts i.e show a chart with only the selected company and the top 10 'nearest' companies, rather than all 200. Not sure this will be so easy but if anyone knows a clever technique e.g. if(Company=Variable... where Variable is a string of the top 10 companies that could work...
Open to all ideas and any comments on whether it is possible.
Many thanks,
T
- Mark as New
- Bookmark
- Subscribe
- Mute
- Subscribe to RSS Feed
- Permalink
- Report Inappropriate Content
Simply calculate all the distances between each location in the script. You can then order that new table so that the company pairs are order by distance. Something like:
Temp:
LOAD Company as A, X as X1, Y as Y1 FROM ...
Join(Temp)
LOAD Company as B, X as X2, Y as Y2 FROM ...
TempDistance
LOAD *, Sqrt(Sqr(X1-X2)+Sqr(Y1-Y2)) as Distance
Resident Temp
Drop Table Temp;
Result:
LOAD A, B, Distance
Resident Temp
Order By A, Distance;
Drop Table TempDistance;
talk is cheap, supply exceeds demand
- Mark as New
- Bookmark
- Subscribe
- Mute
- Subscribe to RSS Feed
- Permalink
- Report Inappropriate Content
Thanks for your reply Gysbert.
I actually think I have got it working since making this post. I'm afraid your solution wouldn't work as the user needs to be able to select the Company and its attributes on the front end without a reload afterwards as they'd be doing this on the server.
Your solution would filter but give the sum of the sqrts rather than the sqrt of the sums. The real difficult came as I needed to find the top 10 companies by 'distance' and then filter the dimension of other charts by just those 10. Fortunately I could use Concat() combined with Rank() to produce a string of the top 10 companies, and then set this as a variable. I then use the variable in an IF statement in the dimension of any charts I need to filter. Took a bit of fiddling but I think I've got there in the end!
- Mark as New
- Bookmark
- Subscribe
- Mute
- Subscribe to RSS Feed
- Permalink
- Report Inappropriate Content
If you calculate all the distances between each location in advance then the users can make any selections they want. Locations do not change position on user selections in my experience.
Sqrt(Sqr(X1-X2)+Sqr(Y1-Y2))
Sqrt is the square root. Sqr is the square. So my expression calculates the square root of the sum of the squares. As far as I know that is how the distance between to points is calculated.
talk is cheap, supply exceeds demand