Unlock a world of possibilities! Login now and discover the exclusive benefits awaiting you.
- Qlik Community
- :
- All Forums
- :
- QlikView App Dev
- :
- Re: Dynamic KPI selection
- Subscribe to RSS Feed
- Mark Topic as New
- Mark Topic as Read
- Float this Topic for Current User
- Bookmark
- Subscribe
- Mute
- Printer Friendly Page
- Mark as New
- Bookmark
- Subscribe
- Mute
- Subscribe to RSS Feed
- Permalink
- Report Inappropriate Content
Dynamic KPI selection
Dear community,
I would like to let the user decide which KPIs are displayed on one of my sheets.
The KPIs are selected in an input box, an optional list provides the name of the KPIs.
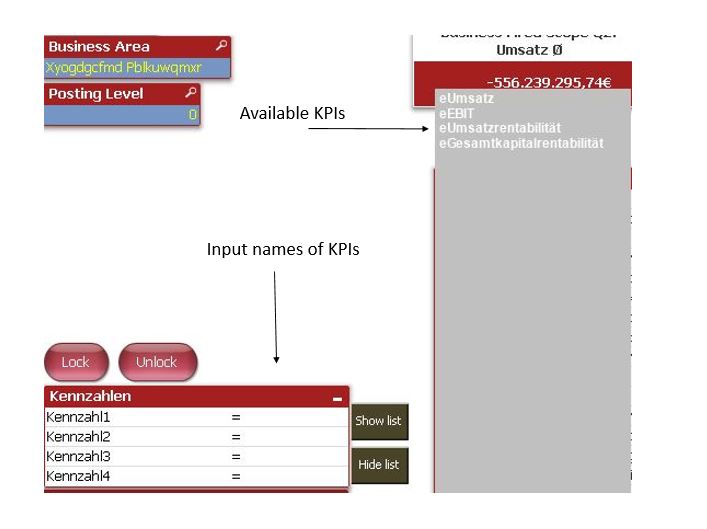
The problem I am facing is that the dashboard displays an average KPI for all companies and individuals KPIs for every single company (ManagementID).
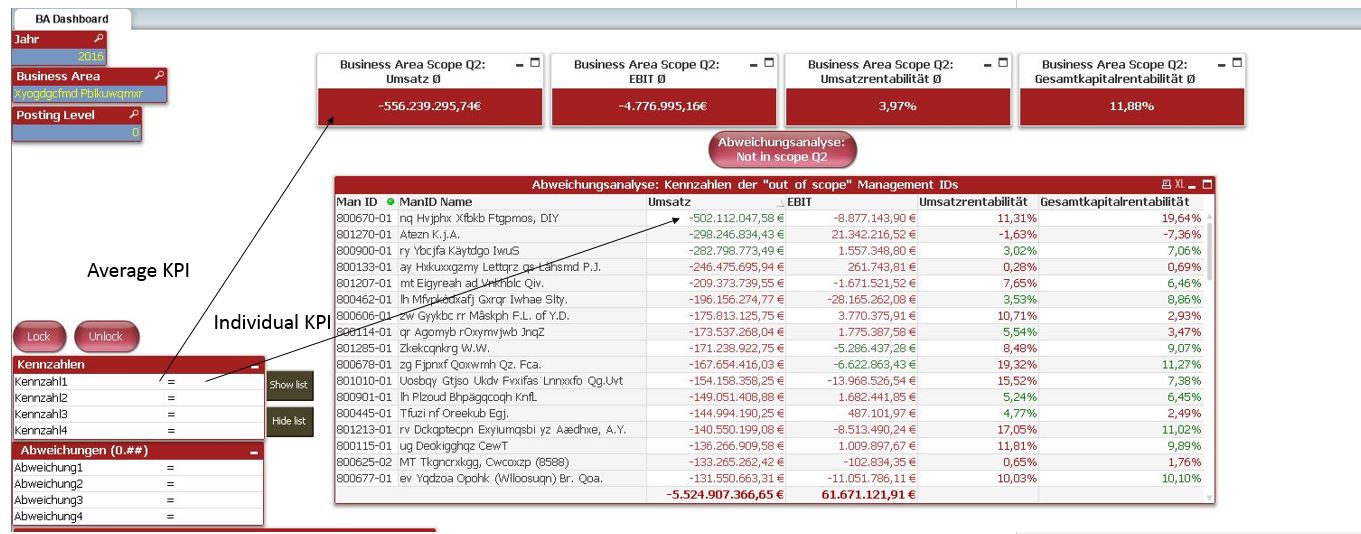
The expressions and used variables for individual/averages values are different.
For the individual KPIs in the straight table it's just the chosen KPI itself, e.g.
$(eUmsatzrentabilität)
The average KPI expression, however, uses a different variable:
=Num(Avg({<Scope={'Scope Q2'}, [Management ID]>} Aggr($(eUmsatzrentabilitätManID),[Management ID])), '#,##%')
The variable is called
$(eUmsatzrentabilitätManID)
As you can see, the variables are always named in this fashion, the variable used for the averages is named like the variable for the individual KPIs + 'ManID'
To dynamically change the calculation of the individual KPIs I can just use $(eKennzahl1), $(eKennzahl2) in the straight table.
But how do I also adjust the expressions for the averages?
Can we use something like
=Num(Avg({<Scope={'Scope Q2'}, [Management ID]>} Aggr(
$(eKennzahl1&ManID)
,[Management ID])), '#,##%')
?
I will attach the sample file.
!
Thanks in advance.
Best regards,
Mats
- « Previous Replies
-
- 1
- 2
- Next Replies »
- Mark as New
- Bookmark
- Subscribe
- Mute
- Subscribe to RSS Feed
- Permalink
- Report Inappropriate Content
Thanks Ronald! I will get back to you soon
- Mark as New
- Bookmark
- Subscribe
- Mute
- Subscribe to RSS Feed
- Permalink
- Report Inappropriate Content
Hi,
I don't know if this makes it any more clear.
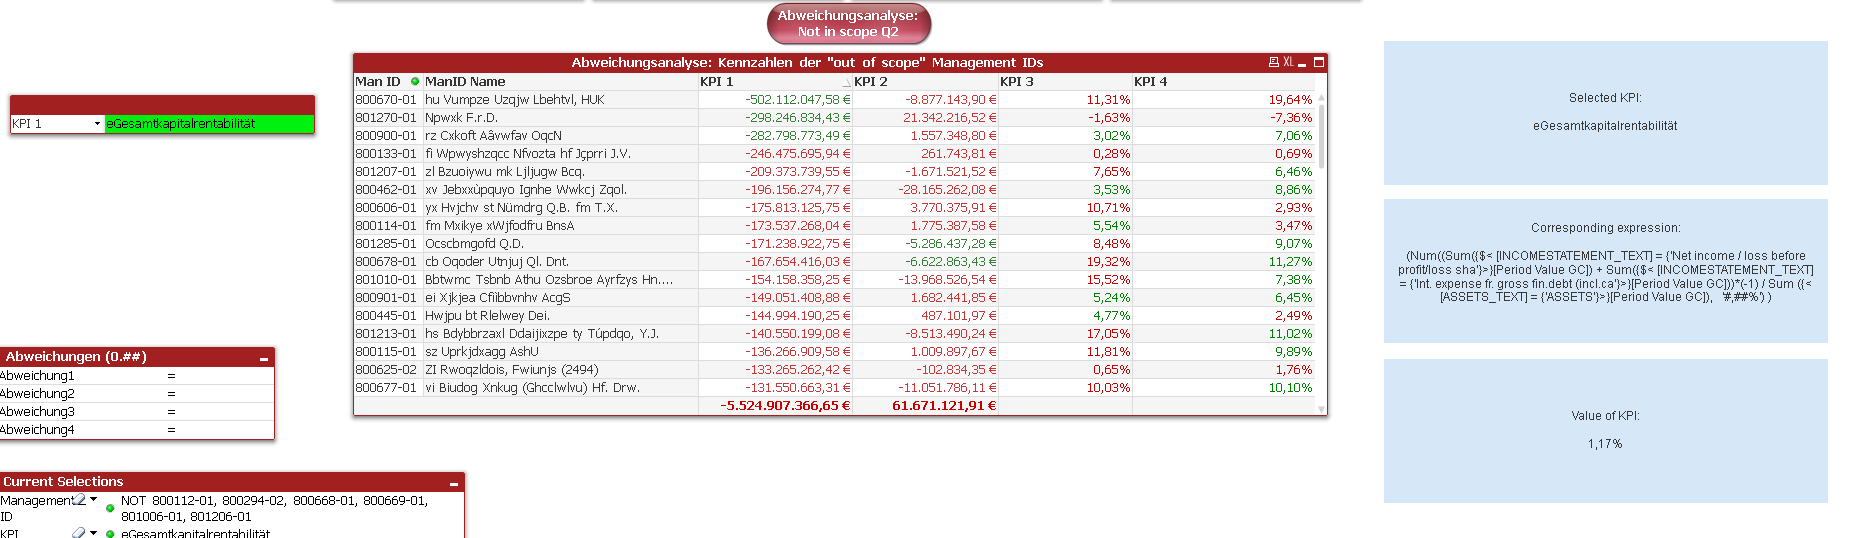
I just added a few KPIs to a table. I guess in order to select 4 different KPIs from the same pool I'll just load the same table 4 times.
Now what's displayed here for KPI 1 = eUmsatz ist just what I want to see. I select the KPI from the Multibox and the used variables in the KPI objects on the right adjust accordingly.
Please let me know if you have any further questions.
Thanks again.
Best regards,
Mats
- Mark as New
- Bookmark
- Subscribe
- Mute
- Subscribe to RSS Feed
- Permalink
- Report Inappropriate Content
Hi Mats,
I have taken the liberty of adding some text boxes with the "steps" behind my reasoning.
Apart from that (and enabling "Always one selected value" on your multibox (optional, but advisable) I have not changed anything.
Please let me know if this works for you at all.
With kind regards,
Ronald
- Mark as New
- Bookmark
- Subscribe
- Mute
- Subscribe to RSS Feed
- Permalink
- Report Inappropriate Content
Hi Ronald,
Thank you for taking the time to do this.
This looks very promising, I can now use the expression in the straight table.
Can you tell me how the according expression/variable for the average values looks like?
Best regards,
Mats
- Mark as New
- Bookmark
- Subscribe
- Mute
- Subscribe to RSS Feed
- Permalink
- Report Inappropriate Content
I think it should be something like this:
=Num(Avg({<Scope={'Scope Q2'}, [Management ID]>} Aggr($($(=GetFieldSelections(KPI)&ManID)),[Management ID])), '#,##%')
- Mark as New
- Bookmark
- Subscribe
- Mute
- Subscribe to RSS Feed
- Permalink
- Report Inappropriate Content
Ah, I got it, just had to add the ' ' around ManID. Thanks again for your help!
Clean and simple solution.
- Mark as New
- Bookmark
- Subscribe
- Mute
- Subscribe to RSS Feed
- Permalink
- Report Inappropriate Content
Hi Mats,
Great to hear it worked for you.
If =Num(Avg({<Scope={'Scope Q2'}, [Management ID]>} Aggr($($(=GetFieldSelections(KPI)&ManID)),[Management ID])), '#,##%') works for all your KPI's, that's fine.
If it doesn't, you could also store the "average" expression into eGesamtkapitalrentabilität_Average (so: KPI name & _Average). That way, you could have your KPI-textbox display $($(=GetFieldSelections(KPI)&'_Average')) and you would be able to set an expression for the KPI textbox that differs from the table.
- « Previous Replies
-
- 1
- 2
- Next Replies »