Unlock a world of possibilities! Login now and discover the exclusive benefits awaiting you.
Announcements
FLASH SALE: Save $500! Use code FLASH2026 at checkout until Feb 14th at 11:59PM ET. Register Now!
- Qlik Community
- :
- All Forums
- :
- QlikView App Dev
- :
- Dynamic Report
Options
- Subscribe to RSS Feed
- Mark Topic as New
- Mark Topic as Read
- Float this Topic for Current User
- Bookmark
- Subscribe
- Mute
- Printer Friendly Page
Turn on suggestions
Auto-suggest helps you quickly narrow down your search results by suggesting possible matches as you type.
Showing results for
Not applicable
2012-09-17
06:00 PM
- Mark as New
- Bookmark
- Subscribe
- Mute
- Subscribe to RSS Feed
- Permalink
- Report Inappropriate Content
Dynamic Report
Hi All,
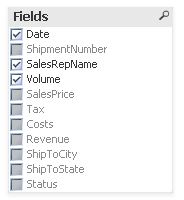
I want to build a dynamic graph that only shows the columns of data that the user selects in the check box. But I can't seem to get the conditional formatting to work when there are multiple selections in 'Fields'.
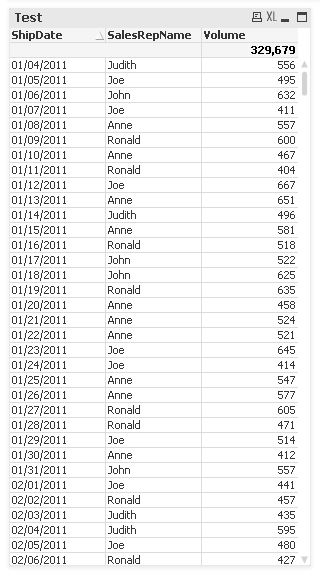
For example, when the following is selected, I want to see this:
Your help is appreciated!
753 Views
1 Solution
Accepted Solutions
Specialist
2012-09-18
01:52 AM
- Mark as New
- Bookmark
- Subscribe
- Mute
- Subscribe to RSS Feed
- Permalink
- Report Inappropriate Content
555 Views
3 Replies
MVP
2012-09-17
06:07 PM
- Mark as New
- Bookmark
- Subscribe
- Mute
- Subscribe to RSS Feed
- Permalink
- Report Inappropriate Content
Hi
Use Enable Condition in all dimensions
Ex:
Click status:
Enable condition
use GetCurrentSelections(Field) = 'Status'
Hope it helps
Thanks & Regards, Mayil Vahanan R
Please close the thread by marking correct answer & give likes if you like the post.
Please close the thread by marking correct answer & give likes if you like the post.
Specialist
2012-09-18
01:52 AM
- Mark as New
- Bookmark
- Subscribe
- Mute
- Subscribe to RSS Feed
- Permalink
- Report Inappropriate Content
PFA..
Regards,
Rajni
556 Views
Not applicable
2012-09-18
09:01 AM
Author
- Mark as New
- Bookmark
- Subscribe
- Mute
- Subscribe to RSS Feed
- Permalink
- Report Inappropriate Content
That is exactly what I needed. Thank you!
555 Views