Unlock a world of possibilities! Login now and discover the exclusive benefits awaiting you.
- Qlik Community
- :
- All Forums
- :
- QlikView App Dev
- :
- Expression as Dimension
- Subscribe to RSS Feed
- Mark Topic as New
- Mark Topic as Read
- Float this Topic for Current User
- Bookmark
- Subscribe
- Mute
- Printer Friendly Page
- Mark as New
- Bookmark
- Subscribe
- Mute
- Subscribe to RSS Feed
- Permalink
- Report Inappropriate Content
Expression as Dimension
Hello,
I have this expression: count(distinct x)/Count(distinct TOTAL(x)).
And i would like to see have the results on dimension, however when i put this expression on dimension it gives me an error.
How can it be done?
Can you give me some pointers?
thank you
- « Previous Replies
-
- 1
- 2
- Next Replies »
- Mark as New
- Bookmark
- Subscribe
- Mute
- Subscribe to RSS Feed
- Permalink
- Report Inappropriate Content
???
- Mark as New
- Bookmark
- Subscribe
- Mute
- Subscribe to RSS Feed
- Permalink
- Report Inappropriate Content
last idea:
- Mark as New
- Bookmark
- Subscribe
- Mute
- Subscribe to RSS Feed
- Permalink
- Report Inappropriate Content
i do not understand the first files dimension data.
i think that the second file is the original one. i do not see any differences.
thank you
- Mark as New
- Bookmark
- Subscribe
- Mute
- Subscribe to RSS Feed
- Permalink
- Report Inappropriate Content
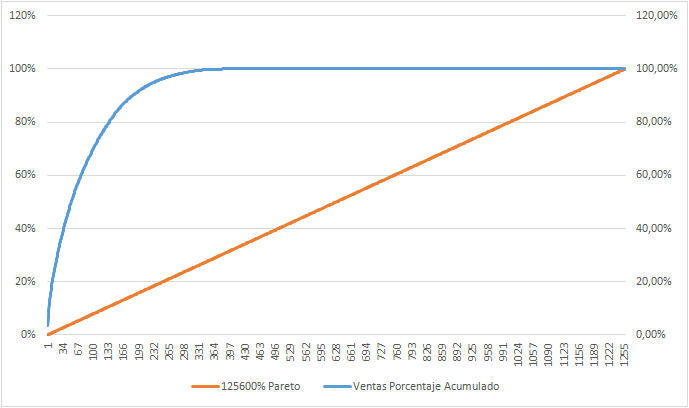
the last I uploaded has a scale from 0% to 100% instead of 0 to 1.
This looks now like your Excel file:
- Mark as New
- Bookmark
- Subscribe
- Mute
- Subscribe to RSS Feed
- Permalink
- Report Inappropriate Content
You are right, but on the graph they are on the dimension that is why the curve of the graph it is like that, and on your file the curve is not the same.
i would like for example 10% of the clients make 30% of the sales and so on.
Something like that
- Mark as New
- Bookmark
- Subscribe
- Mute
- Subscribe to RSS Feed
- Permalink
- Report Inappropriate Content
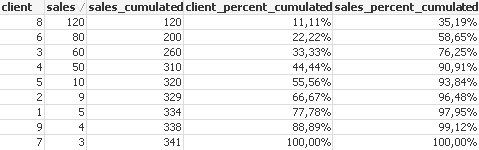
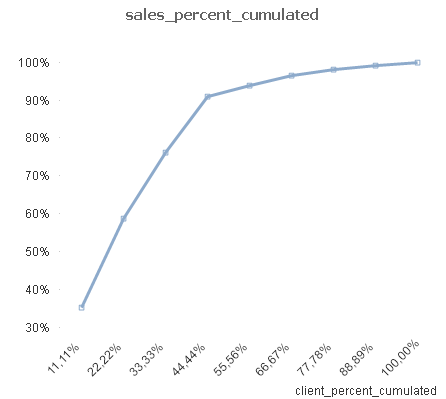
ok, here's another approach, script based:
UNQUALIFY *;
TEMP:
LOAD * INLINE [
client, sales
1, 5
2, 9
3, 60
4, 50
5, 10
6, 40
6, 40
7, 3
8, 120
9, 1
9, 3
];
NoConcatenate
TEMP2:
LOAD
client,
sum(sales) as sales
Resident TEMP
Group by client;
drop Table TEMP;
NoConcatenate
TEMP:
LOAD
*
Resident TEMP2
Order by sales desc;
drop Table TEMP2;
TEMP2:
LOAD sum(sales) as sum_sales
Resident TEMP;
LET sum_sales= Peek('sum_sales');
drop Table TEMP2;
SET buffer = 0;
SET buffer2 = 0;
FOR i=0 to NoOfRows('TEMP')-1
FINAL:
LOAD
Peek('sales',$(i),'TEMP') as "sales",
RangeSum(Peek('sales',$(i),'TEMP'),$(buffer)) as "sales_cumulated",
num(RangeSum(Peek('sales',$(i),'TEMP'),$(buffer))/ $(sum_sales),'#.##0,00%') as "sales_percent_cumulated",
Peek('client',$(i),'TEMP') as "client",
num(($(i) +1) / NoOfRows('TEMP'),'#.##0,00%') as "client_percent_cumulated"
autogenerate(1);
LET buffer = RangeSum($(buffer),Peek('sales',$(i),'TEMP'));
NEXT
DROP Table TEMP;
- Mark as New
- Bookmark
- Subscribe
- Mute
- Subscribe to RSS Feed
- Permalink
- Report Inappropriate Content
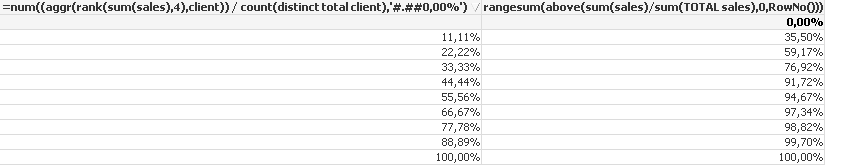
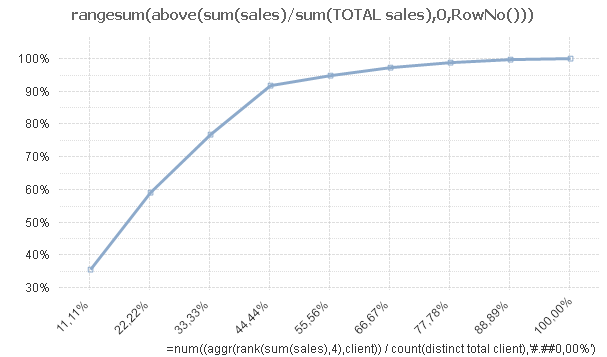
with the help of Frank Hartmann, I finally got it also working without scripting:
(Possible getting "RowNo()" of a dimension?!?)
- « Previous Replies
-
- 1
- 2
- Next Replies »