Unlock a world of possibilities! Login now and discover the exclusive benefits awaiting you.
- Qlik Community
- :
- All Forums
- :
- QlikView App Dev
- :
- Expression hard code
- Subscribe to RSS Feed
- Mark Topic as New
- Mark Topic as Read
- Float this Topic for Current User
- Bookmark
- Subscribe
- Mute
- Printer Friendly Page
- Mark as New
- Bookmark
- Subscribe
- Mute
- Subscribe to RSS Feed
- Permalink
- Report Inappropriate Content
Expression hard code
I would like to write an expression for a line graph that does the following:
When Year 2017 is selected make Jan = 11400, Feb = 11400, Mar = 11400, Apr = 11400, May = 11400, Jun = 11400, Jul = 11400, Aug = 11400, Sep = 11400, Oct = 11400, Nov = 11400, Dec = 11400
- Mark as New
- Bookmark
- Subscribe
- Mute
- Subscribe to RSS Feed
- Permalink
- Report Inappropriate Content
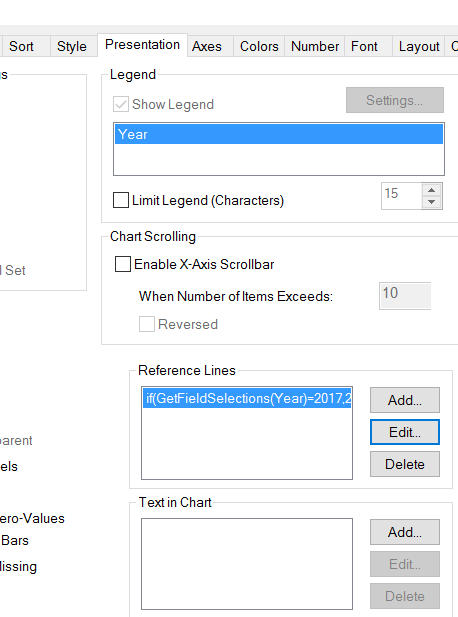
Try to add : if(GetFieldSelections(Year)=2017,11400) in Presentation/References lines
- Mark as New
- Bookmark
- Subscribe
- Mute
- Subscribe to RSS Feed
- Permalink
- Report Inappropriate Content
May be something like this?
What is that 11400 just a hardcoded value or a value coming from a expression field.
If month is your dimension.
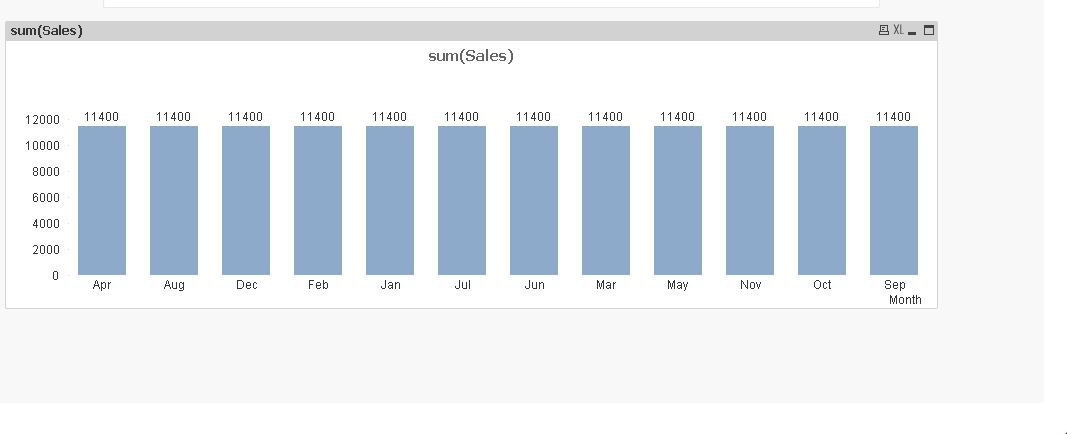
You can just write
= IF(Year = '2017', 11400, Sum(yourvaluefield))
- Mark as New
- Bookmark
- Subscribe
- Mute
- Subscribe to RSS Feed
- Permalink
- Report Inappropriate Content
Hi Amber,
May be as a variant.
We believe that the autoCalendar has linked fields Date, Month and Year. Furhter add script code
Table2017:
Load*Inline
[Month2017, Vol2017
Jan, 11400
Feb, 11400
Mar, 11400
Apr, 11400
May, 11400
Jun, 11400
Jul, 11400
Aug, 11400
Oct, 11400
Nov, 11400
Dec, 11400];
We create a chart with dimension Month2017 and expression Vol2017
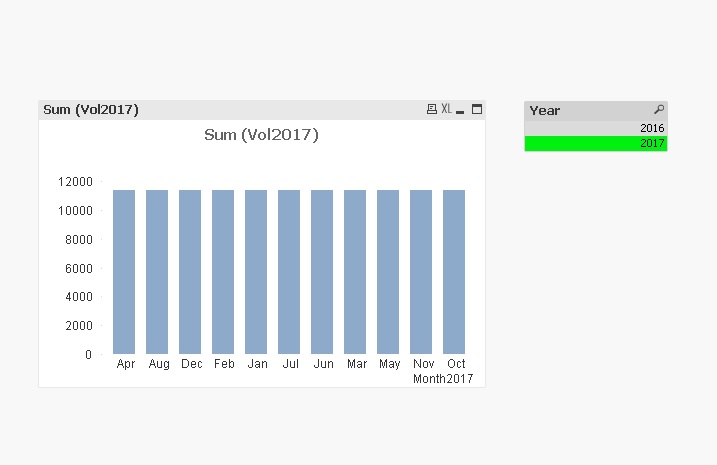
Finally, we specify the condition for calculating the expression
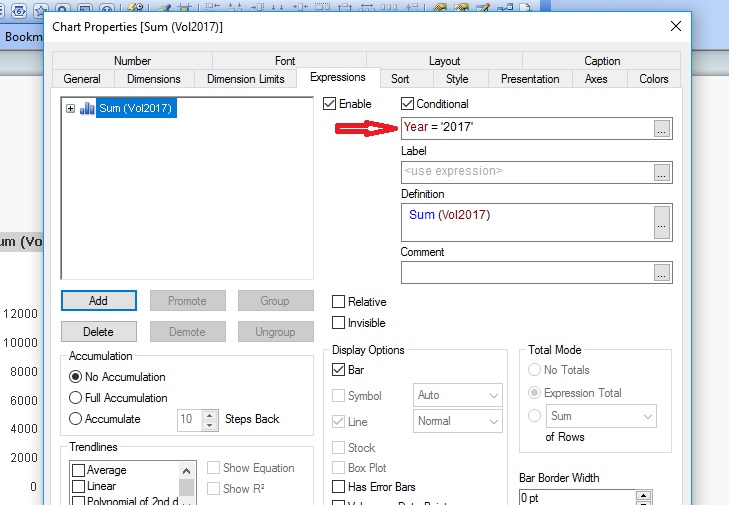
Regards,
Andrey
- Mark as New
- Bookmark
- Subscribe
- Mute
- Subscribe to RSS Feed
- Permalink
- Report Inappropriate Content
can you share the dummy data, as we can understand there is just 2017 for the selection or any other years. if we create a inline table of year=2017 and month from Jan-Dec and mention the amount 11400 in form of it then it will give you the data required.
- Mark as New
- Bookmark
- Subscribe
- Mute
- Subscribe to RSS Feed
- Permalink
- Report Inappropriate Content
Jean,
My graph toggles from month to quarter. I tried this and it does work well but when I toggle from month to quarter the amount stays 11400 instead of becoming a quarterly amount.
- Mark as New
- Bookmark
- Subscribe
- Mute
- Subscribe to RSS Feed
- Permalink
- Report Inappropriate Content
11400 is just a hardcoded value. My dimension is a cyclical group that toggles from month to quarter. The main issue I am running into is when I toggle from month to quarter the 11400 does not change to a quarterly amount.