Unlock a world of possibilities! Login now and discover the exclusive benefits awaiting you.
- Qlik Community
- :
- All Forums
- :
- QlikView App Dev
- :
- Expression label Syntax
- Subscribe to RSS Feed
- Mark Topic as New
- Mark Topic as Read
- Float this Topic for Current User
- Bookmark
- Subscribe
- Mute
- Printer Friendly Page
- Mark as New
- Bookmark
- Subscribe
- Mute
- Subscribe to RSS Feed
- Permalink
- Report Inappropriate Content
Expression label Syntax
Please can somebody help,
I have written custom expressions within a pivot table object and simply want the 'total' expressions titles to display in bold text. I know the bold syntax is '<B>' but can't get the syntax right. I am a novice.
This:
=('<B>'&'Total Available Group Funds')
isn't working.
Please help.
Thanks
- Tags:
- new_to_qlikview
- « Previous Replies
-
- 1
- 2
- Next Replies »
- Mark as New
- Bookmark
- Subscribe
- Mute
- Subscribe to RSS Feed
- Permalink
- Report Inappropriate Content
Whatever "it is not a real pivot table" means, looks like you have to find another way to highlight your total columns. Maybe all bold, as ChrisLofthouse mentioned, or use a background color for the column.
- Mark as New
- Bookmark
- Subscribe
- Mute
- Subscribe to RSS Feed
- Permalink
- Report Inappropriate Content
Hi Andrew,
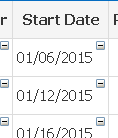
I have pasted a screen shot of the table below and marked the rows of the pivot table object in red that I want to be highlighted in bold.
Here is the expression screen
Thanks
- Mark as New
- Bookmark
- Subscribe
- Mute
- Subscribe to RSS Feed
- Permalink
- Report Inappropriate Content
Hi Francis,
I believe this is what you're looking for:
Chart Properties --> Visual Cues --> Expressions - select the expression of interest, go to the 'Text' check boxes below, and select Bold.
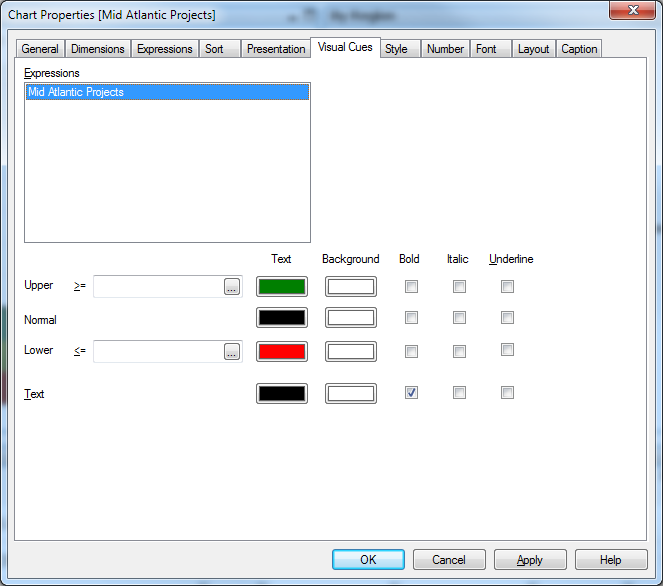
Desired output should look something like this:
I hope that helps.
-Kristan
- « Previous Replies
-
- 1
- 2
- Next Replies »