Unlock a world of possibilities! Login now and discover the exclusive benefits awaiting you.
- Qlik Community
- :
- All Forums
- :
- QlikView App Dev
- :
- Expression
- Subscribe to RSS Feed
- Mark Topic as New
- Mark Topic as Read
- Float this Topic for Current User
- Bookmark
- Subscribe
- Mute
- Printer Friendly Page
- Mark as New
- Bookmark
- Subscribe
- Mute
- Subscribe to RSS Feed
- Permalink
- Report Inappropriate Content
Expression
Hi all ,
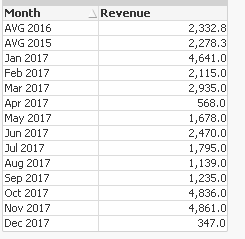
All my requirement was to show the Average of 2015 and 2016 and current years count for all the 12 months.
It worked for me perfectly when i used the dummy data .
And when iam using the real time data it is not working ....
Below is the screenshot of the working table .
Please find the attachment of the QVW file which has the real time data .
Can someone please suggest me on this
regards
Accepted Solutions
- Mark as New
- Bookmark
- Subscribe
- Mute
- Subscribe to RSS Feed
- Permalink
- Report Inappropriate Content
Are you looking for this may be
Pick(Dim,
count({<Created={">=$(=YearStart(Today()))<=$(=YearEnd(Today()))"}>} Revenue),
Count({<Created={">=$(=YearStart(Today(),-1))<=$(=YearEnd(Today(),-1))"}>} Revenue)/12,
Count({<Created={">=$(=YearStart(Today(),-2))<=$(=YearEnd(Today(),-2))"}>} Revenue)/12)

- Mark as New
- Bookmark
- Subscribe
- Mute
- Subscribe to RSS Feed
- Permalink
- Report Inappropriate Content
Revenue is a text field... how can find it's average?
Also, try this as your dimension
=Pick(Dim,MonthName(Created),'AVG 2016','AVG 2015')
- Mark as New
- Bookmark
- Subscribe
- Mute
- Subscribe to RSS Feed
- Permalink
- Report Inappropriate Content
I also suggest creating a MonthYear field in the script like this
Data:
LOAD JIRA_KEY_ID as Revenue,
Timestamp(Timestamp#(left(CREATE_DATE,18),'DD-MMM-YYYY hh.mm.ss'),'DD-MM-YYYY') as Created,
Date(MonthStart(TimeStamp#(Left(CREATE_DATE,18),'DD-MMM-YYYY hh.mm.ss')), 'MMM YYYY') as MonthYear
FROM
(ooxml, embedded labels, table is [Export Worksheet]);
- Mark as New
- Bookmark
- Subscribe
- Mute
- Subscribe to RSS Feed
- Permalink
- Report Inappropriate Content
Hi Sunny ,
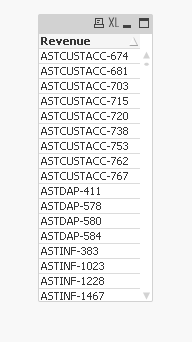
Yes it is texy field
they are considered to be thr ID's thereofre we are counting it .
- Mark as New
- Bookmark
- Subscribe
- Mute
- Subscribe to RSS Feed
- Permalink
- Report Inappropriate Content
But you are averaging them also?
Pick(Dim,
count({<Created={">=$(=YearStart(Today()))<=$(=YearEnd(Today()))"}>} Revenue),
Avg({<Created={">=$(=YearStart(Today(),-1))<=$(=YearEnd(Today(),-1))"}>} Revenue),
Avg({<Created={">=$(=YearStart(Today(),-2))<=$(=YearEnd(Today(),-2))"}>} Revenue))
- Mark as New
- Bookmark
- Subscribe
- Mute
- Subscribe to RSS Feed
- Permalink
- Report Inappropriate Content
Are you looking for this may be
Pick(Dim,
count({<Created={">=$(=YearStart(Today()))<=$(=YearEnd(Today()))"}>} Revenue),
Count({<Created={">=$(=YearStart(Today(),-1))<=$(=YearEnd(Today(),-1))"}>} Revenue)/12,
Count({<Created={">=$(=YearStart(Today(),-2))<=$(=YearEnd(Today(),-2))"}>} Revenue)/12)
- Mark as New
- Bookmark
- Subscribe
- Mute
- Subscribe to RSS Feed
- Permalink
- Report Inappropriate Content
Yes Bro .
You are always Awesome
Thansk a lot