Unlock a world of possibilities! Login now and discover the exclusive benefits awaiting you.
- Qlik Community
- :
- All Forums
- :
- QlikView App Dev
- :
- Extract data from files with same format
- Subscribe to RSS Feed
- Mark Topic as New
- Mark Topic as Read
- Float this Topic for Current User
- Bookmark
- Subscribe
- Mute
- Printer Friendly Page
- Mark as New
- Bookmark
- Subscribe
- Mute
- Subscribe to RSS Feed
- Permalink
- Report Inappropriate Content
Extract data from files with same format
I am trying to create a simple QV with program data including revenue, forecast, upside, and downside values over one year. I created excel tables with months across the columns and rows per program with values in cells, e.g.
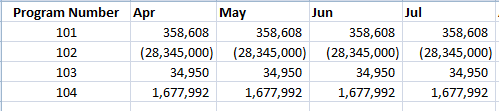
I have one file each for revenue, forecast, upside, and downside, and I have a file with program info that has program number along with other metadata on the program. However, when adding files via the script editor, my model only shows program info and the first file loaded with financial data, not all of revenue, forecast, upside, and downside. Is this because the row and column headings are the same across the files? How should I create the spreadsheet to create a good mockup QV to demo financial reports?
- Tags:
- new_to_qlikview
- Mark as New
- Bookmark
- Subscribe
- Mute
- Subscribe to RSS Feed
- Permalink
- Report Inappropriate Content
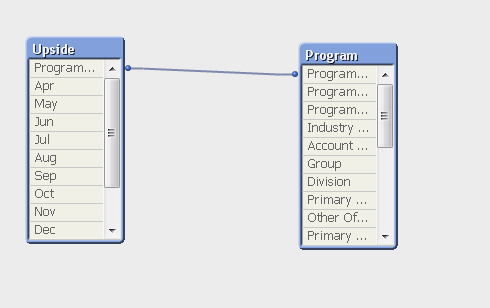
If you load data from a source that has exactly the same number of fields with exactly the same field names as an existing table (from data you loaded earlier) then the data from the second load is appended to the first. It sounds like that is what happened in your case. This is usually a very good thing. But to be able to keep track of which data came from which source it's a good idea to create an additional Source field:
MyData:
Load *, 'Source A' as Source from sourceA;
Load *, 'Source B' as Source from sourceB;
...etc
Looking at you screenshots it looks like you may want to use the Crosstable function too:
MyData:
CrossTable(Month,Value,2)
Load [Program Number], 'Source A' as Source from sourceA;
CrossTable(Month,Value,2)
Load [Program Number], 'Source B' as Source from sourceB;
...etc
talk is cheap, supply exceeds demand