Unlock a world of possibilities! Login now and discover the exclusive benefits awaiting you.
- Qlik Community
- :
- All Forums
- :
- QlikView
- :
- Filter Chart with variable
- Subscribe to RSS Feed
- Mark Topic as New
- Mark Topic as Read
- Float this Topic for Current User
- Bookmark
- Subscribe
- Mute
- Printer Friendly Page
- Mark as New
- Bookmark
- Subscribe
- Mute
- Subscribe to RSS Feed
- Permalink
- Report Inappropriate Content
Filter Chart with variable
Hi i have those two variables:
Set vAnnoTempo = GetFieldSelections(ANNOTEMPO);
Set vMeseTempo = GetFieldSelections(MESETEMPO);
ANNOTEMPO and MESETEMPO are fields of my TIME_TABLE
i want those variables takes from my fields selection:

When i choose for example Anno: 2017 Mese: 2
I want my chart will be filter from my vAnnoTempo and vMeseTempo, but its not start
The set analisys expression i have in my chart is:
=Sum({<ANNO_IN={"=$(vAnnoTempo)"},MESE_IN={"=$(vMeseTempo)"}>} CONSUMO_TOT_ANNUO)
ANNO_IN and MESE_IN are my fields in my CONTR table.
p.s.: CONTR table and TIME_TABLE are not connected, and this is correct, i not want are connected, i want do my filter with set analisys in this way, becouse for every dimension i have in my chart i need to do a different set analisys
Thanks
- « Previous Replies
- Next Replies »
- Mark as New
- Bookmark
- Subscribe
- Mute
- Subscribe to RSS Feed
- Permalink
- Report Inappropriate Content
hello
,
where do you set your variables ? why do you need to use them ?
why don't you crate 2 listboxes, 1 for ANNO, 1 for MESE so you graph will take those values directly
- Mark as New
- Bookmark
- Subscribe
- Mute
- Subscribe to RSS Feed
- Permalink
- Report Inappropriate Content
Hi i set the variable in the SCRIPT (where i write LOAD and others)
i have create 2 listboxes with those sure, but the problem is my graph is not CONNECTED to that table, i use those only for do my set analisys, my graph must be populate with some columns with some different set analisys.
Like i wrote my set analisys for my first expression must be:
=Sum({<ANNOIN={"=$(vAnnoTempo)"},MESEIN={"=$(vMeseTempo)"}>} CONSUMO_TOT_ANNUO)
for other expressions i need to do others set analisys...
and my CONTR table (the table where i do the graph) is NOT connected with my TIME_TABLE (where i set my variables) so i need to do this set analisys....
btw i not understand why this set analisys not works, becouse is if i display in a text area my $(vAnnoTempo) and my $(vMeseTempo) it show correctly, and if i change from my list box the ANNOTEMPO and MESETEMPO the variables changes correctly... but my set analisys not works
- Mark as New
- Bookmark
- Subscribe
- Mute
- Subscribe to RSS Feed
- Permalink
- Report Inappropriate Content
when you say your set analysis doesn't work, does it mean no result or does the graph display all asif there was no selection ?
if it is the 2nd, that means the values are empty, so the set analysis selects all
try to write it this way :
=Sum({<ANNOIN={'$(vAnnoTempo)'},MESEIN={'$(vMeseTempo)'}>} CONSUMO_TOT_ANNUO)
- Mark as New
- Bookmark
- Subscribe
- Mute
- Subscribe to RSS Feed
- Permalink
- Report Inappropriate Content
the 2nd, it display the all, but the values of my variables are not empty becouse if i display in a text box it show me the values
your set analisys not works, it show me nothing, 0
thanks
- Mark as New
- Bookmark
- Subscribe
- Mute
- Subscribe to RSS Feed
- Permalink
- Report Inappropriate Content
so that means it filters something (even if is nothing)
when you say : i set the variable in the SCRIPT (where i write LOAD and others)
it means the values are never refreshed
how do you refresh them with the selections made ?
- Mark as New
- Bookmark
- Subscribe
- Mute
- Subscribe to RSS Feed
- Permalink
- Report Inappropriate Content
i set it in the script yes in this way:
Set vAnnoTempo = GetFieldSelections(ANNOTEMPO);
Set vMeseTempo = GetFieldSelections(MESETEMPO);
in my visualization i have two select list, like you see in this image:

when i choose the 2017 for example in my text box showing the $(vAnnoTempo) i see: 2017
if i choose the 2018 in my text box showint the $(vAnnoTempo) i see: 2018
but in my set analisys in the expression in my graph is like it nothing do...
- Mark as New
- Bookmark
- Subscribe
- Mute
- Subscribe to RSS Feed
- Permalink
- Report Inappropriate Content
can you post the part of your application containing the grah, the boxes, the script and a piece of data ?
- Mark as New
- Bookmark
- Subscribe
- Mute
- Subscribe to RSS Feed
- Permalink
- Report Inappropriate Content
post the application is impossible but i will try to do an example... sincerly is strange i thought the set analisys is correct....
- Mark as New
- Bookmark
- Subscribe
- Mute
- Subscribe to RSS Feed
- Permalink
- Report Inappropriate Content
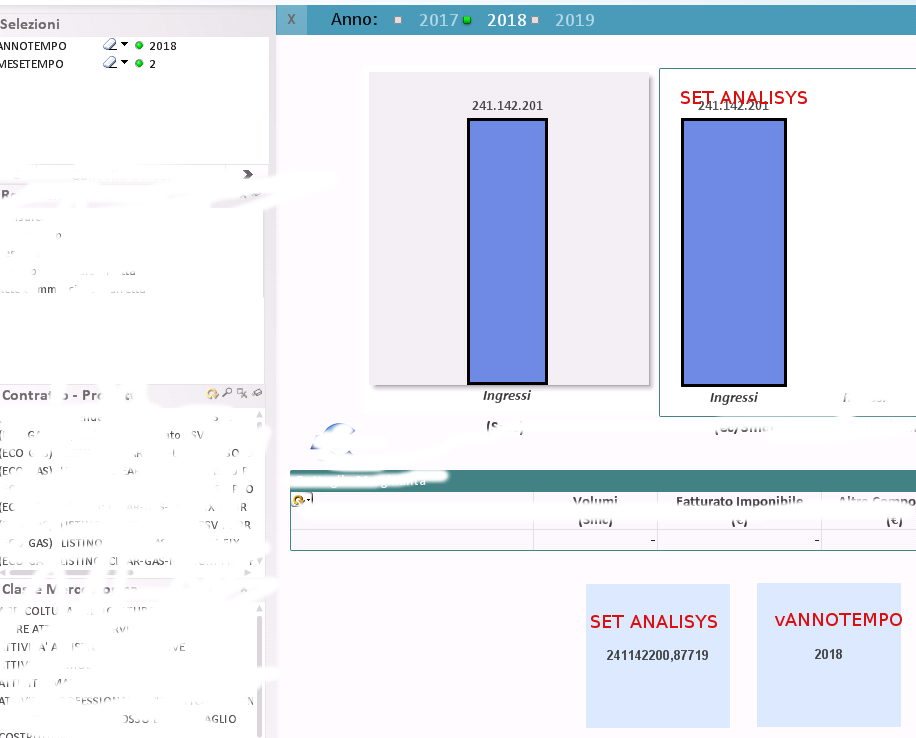
This is... you can look vAnnoTempo text box display the right value i choose 2018, but the set analisys show me a big big value... it not filter : =Sum({<ANNOIN={"=$(vAnnoTempo)"},MESEIN={"=$(vMeseTempo)"}>} CONSUMO_TOT_ANNUO)
- « Previous Replies
- Next Replies »