Unlock a world of possibilities! Login now and discover the exclusive benefits awaiting you.
- Qlik Community
- :
- All Forums
- :
- QlikView App Dev
- :
- Filter chart based on multiple input boxes
- Subscribe to RSS Feed
- Mark Topic as New
- Mark Topic as Read
- Float this Topic for Current User
- Bookmark
- Subscribe
- Mute
- Printer Friendly Page
- Mark as New
- Bookmark
- Subscribe
- Mute
- Subscribe to RSS Feed
- Permalink
- Report Inappropriate Content
Filter chart based on multiple input boxes
Hi all,
i am looking for some help to filter a chart using multiple input boxes on the same field.
basically, i have some products with their associated ingredients and the % of those ingredients.
what i want is to be able to filter the products based on the users requests.
so for example if the user wants a product that contains 10% of ingredient1, 14% of ingredient2 and 5% of ingredient 3 i want to be able to see which products meet that specification.
i would like there to be a 'give or take' parameter of 2%, so in the above example i want to see all products that conataon between 8-12% ingreient1, 12-16% ingredient2 and 3-7% ingredient3.
does that make sense?
I guess i would need to use alternate states on the 3 input boxes and 3 ingredient list boxes but i am struggling to get any further.
i have attached an example QVW 
thanks in advanced.
Accepted Solutions
- Mark as New
- Bookmark
- Subscribe
- Mute
- Subscribe to RSS Feed
- Permalink
- Report Inappropriate Content
Try this:
If(Count({<Ingredient = {"$(=SubField(GetFieldSelections(Ingredient, ', ', 1000, 'Param1'), ', ', 1))"}, Vol = {"$(='>=' & ((Param1-2)/100) & '<=' & ((Param1+2)/100))"}>+
<Ingredient = {"$(=SubField(GetFieldSelections(Ingredient, ', ', 1000, 'Param1'), ', ', 2))"}, Vol = {"$(='>=' & ((Param2-2)/100) & '<=' & ((Param2+2)/100))"}>+
<Ingredient = {"$(=SubField(GetFieldSelections(Ingredient, ', ', 1000, 'Param1'), ', ', 3))"}, Vol = {"$(='>=' & ((Param3-2)/100) & '<=' & ((Param3+2)/100))"}>} TOTAL <Product> DISTINCT Ingredient) =
Count({<Ingredient = {"$(=SubField(GetFieldSelections(Ingredient, ', ', 1000, 'Param1'), ', ', 1))"}, Vol = {"$(='>=' & ((Param1-2)/100) & '<=' & ((Param1+2)/100))"}>+
<Ingredient = {"$(=SubField(GetFieldSelections(Ingredient, ', ', 1000, 'Param1'), ', ', 2))"}, Vol = {"$(='>=' & ((Param2-2)/100) & '<=' & ((Param2+2)/100))"}>+
<Ingredient = {"$(=SubField(GetFieldSelections(Ingredient, ', ', 1000, 'Param1'), ', ', 3))"}, Vol = {"$(='>=' & ((Param3-2)/100) & '<=' & ((Param3+2)/100))"}>} TOTAL DISTINCT Ingredient),
Only({<Ingredient = {"$(=SubField(GetFieldSelections(Ingredient, ', ', 1000, 'Param1'), ', ', 1))"}, Vol = {"$(='>=' & ((Param1-2)/100) & '<=' & ((Param1+2)/100))"}>+
<Ingredient = {"$(=SubField(GetFieldSelections(Ingredient, ', ', 1000, 'Param1'), ', ', 2))"}, Vol = {"$(='>=' & ((Param2-2)/100) & '<=' & ((Param2+2)/100))"}>+
<Ingredient = {"$(=SubField(GetFieldSelections(Ingredient, ', ', 1000, 'Param1'), ', ', 3))"}, Vol = {"$(='>=' & ((Param3-2)/100) & '<=' & ((Param3+2)/100))"}>}
Vol))
Don't think the order can be fixed, but will try to check
- Mark as New
- Bookmark
- Subscribe
- Mute
- Subscribe to RSS Feed
- Permalink
- Report Inappropriate Content
Are you thinking of using a set analysis to restrict a particular chart or are you looking to filter these values for the whole dashboard? Also you only have one input box, are you planning to add more input boxes or are you looking for a way to drive everything from one inputbox?
- Mark as New
- Bookmark
- Subscribe
- Mute
- Subscribe to RSS Feed
- Permalink
- Report Inappropriate Content
Thanks for your reply.
I am only looking to restrict the data in the one chart not the full dashboard, so set analysis it is
and what ever works really in regards to the amount of input boxes, in my mind there would be multiple input boxes setup in alternate states (or can this be done without the need to use alternate states)?
in the example i attached, i have created 3 alternate states and 3 variables to be used in the input boxes.
- Mark as New
- Bookmark
- Subscribe
- Mute
- Subscribe to RSS Feed
- Permalink
- Report Inappropriate Content
I think it can be done without alternate state. But you mentioned a range, do you expect users to enter >=0.08<=0.12 or are they going to enter 8 in one input box and 12 in another one? I guess these are the things you will need to decide or discuss with stakeholders. Once you have these things sorted out, it should be fairly simple to implement using set analysis.
- Mark as New
- Bookmark
- Subscribe
- Mute
- Subscribe to RSS Feed
- Permalink
- Report Inappropriate Content
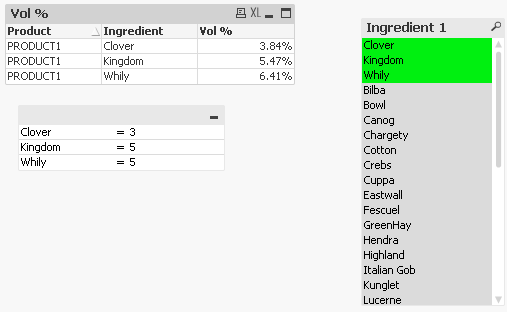
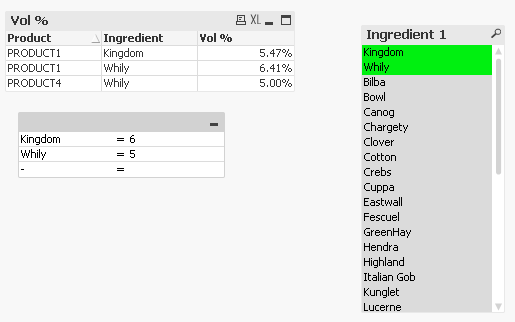
what we want is for a user to select an ingredient from a list box then in the input box enter the % of the ingredient they want.
so for example.
the user selects
Whily
and enters 5 in the input box
i would then want to chart to display any product with between 3-7% Whily, so on this occasion i would expect the chart to filter to Product1 and Product4. (Product1 has 6.41% and Proiduct2 has 5.00%)
but one of the requirements is that the user can select more than 1 ingredient, so..
the user might want to select
Whily
and enters 5 in the input box
then in another list box they select
Kingdon
and enters 6 in the input box
this would then filter the data to show Product1 only.
this is the reason i thought alternate states was needed
does that make sense?
- Mark as New
- Bookmark
- Subscribe
- Mute
- Subscribe to RSS Feed
- Permalink
- Report Inappropriate Content
Check the attached
- Mark as New
- Bookmark
- Subscribe
- Mute
- Subscribe to RSS Feed
- Permalink
- Report Inappropriate Content
thats almost there i think, i have added the 3rd parameter into the set analysis and selected a 3rd ingredient.
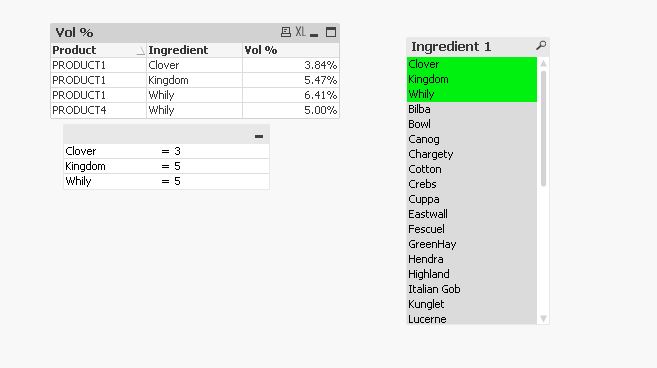
as you can see i am now getting Product 4 inlcuded, but product4 doesnt include Clover or Kingdom so i wouldnt want this to show. do you know how i would resolve that?
i have attached an updated example.
also, i have noticed if i select just 1 ingredient to start and input the % required then hold down CTRL and select the 2nd ingredient the order in the input box changes and the % then appears against the wrong ingredient.
is there a way around this or would the user have to make sure they select all of the ingredients 1st?
- Mark as New
- Bookmark
- Subscribe
- Mute
- Subscribe to RSS Feed
- Permalink
- Report Inappropriate Content
Try this:
If(Count({<Ingredient = {"$(=SubField(GetFieldSelections(Ingredient, ', ', 1000, 'Param1'), ', ', 1))"}, Vol = {"$(='>=' & ((Param1-2)/100) & '<=' & ((Param1+2)/100))"}>+
<Ingredient = {"$(=SubField(GetFieldSelections(Ingredient, ', ', 1000, 'Param1'), ', ', 2))"}, Vol = {"$(='>=' & ((Param2-2)/100) & '<=' & ((Param2+2)/100))"}>+
<Ingredient = {"$(=SubField(GetFieldSelections(Ingredient, ', ', 1000, 'Param1'), ', ', 3))"}, Vol = {"$(='>=' & ((Param3-2)/100) & '<=' & ((Param3+2)/100))"}>} TOTAL <Product> DISTINCT Ingredient) =
Count({<Ingredient = {"$(=SubField(GetFieldSelections(Ingredient, ', ', 1000, 'Param1'), ', ', 1))"}, Vol = {"$(='>=' & ((Param1-2)/100) & '<=' & ((Param1+2)/100))"}>+
<Ingredient = {"$(=SubField(GetFieldSelections(Ingredient, ', ', 1000, 'Param1'), ', ', 2))"}, Vol = {"$(='>=' & ((Param2-2)/100) & '<=' & ((Param2+2)/100))"}>+
<Ingredient = {"$(=SubField(GetFieldSelections(Ingredient, ', ', 1000, 'Param1'), ', ', 3))"}, Vol = {"$(='>=' & ((Param3-2)/100) & '<=' & ((Param3+2)/100))"}>} TOTAL DISTINCT Ingredient),
Only({<Ingredient = {"$(=SubField(GetFieldSelections(Ingredient, ', ', 1000, 'Param1'), ', ', 1))"}, Vol = {"$(='>=' & ((Param1-2)/100) & '<=' & ((Param1+2)/100))"}>+
<Ingredient = {"$(=SubField(GetFieldSelections(Ingredient, ', ', 1000, 'Param1'), ', ', 2))"}, Vol = {"$(='>=' & ((Param2-2)/100) & '<=' & ((Param2+2)/100))"}>+
<Ingredient = {"$(=SubField(GetFieldSelections(Ingredient, ', ', 1000, 'Param1'), ', ', 3))"}, Vol = {"$(='>=' & ((Param3-2)/100) & '<=' & ((Param3+2)/100))"}>}
Vol))
Don't think the order can be fixed, but will try to check
- Mark as New
- Bookmark
- Subscribe
- Mute
- Subscribe to RSS Feed
- Permalink
- Report Inappropriate Content
that seems to do the trick, i will pass this on and see what they think. we can live with selecting all required ingredients before entering %'s.
thanks very much for your help