Unlock a world of possibilities! Login now and discover the exclusive benefits awaiting you.
- Qlik Community
- :
- All Forums
- :
- QlikView App Dev
- :
- Find the position of a value in a list
- Subscribe to RSS Feed
- Mark Topic as New
- Mark Topic as Read
- Float this Topic for Current User
- Bookmark
- Subscribe
- Mute
- Printer Friendly Page
- Mark as New
- Bookmark
- Subscribe
- Mute
- Subscribe to RSS Feed
- Permalink
- Report Inappropriate Content
Find the position of a value in a list
hello,
for one of my Qlikview application i need to find the position of a value (sum(XXX) ) in a list
by example :
list of values (10 possible values not fixed) :
1 -> 1000
2 -> 2000
3 -> 2500
4 -> 2750
my value sum(Indicator) = 2600
i need to know that's it is above 2500 and below 2750 so that the position is 3+ (3,XXX will be fine too)
i can do that with If(sum>value1, ...) but formulas are becoming bigger and bigger and it's hard to update the application (i need to do this kind of operation for 6 indicators with 6 different lists of values).
is there a better and easiest way to do this operation?
Thank you by advance for your Help
- Mark as New
- Bookmark
- Subscribe
- Mute
- Subscribe to RSS Feed
- Permalink
- Report Inappropriate Content
Philippe,
What do you want to do with these values: 1, 2, 3 ... ? Is it a dimension you want to use afterwards ?
If yes, see IntervalMatch() function or the class() one if your intervals are regular.
See a thread showing IntervalMatch() to create a dimension that will be used in a graph: http://community.qlik.com/thread/98796
Fabrice
- Mark as New
- Bookmark
- Subscribe
- Mute
- Subscribe to RSS Feed
- Permalink
- Report Inappropriate Content
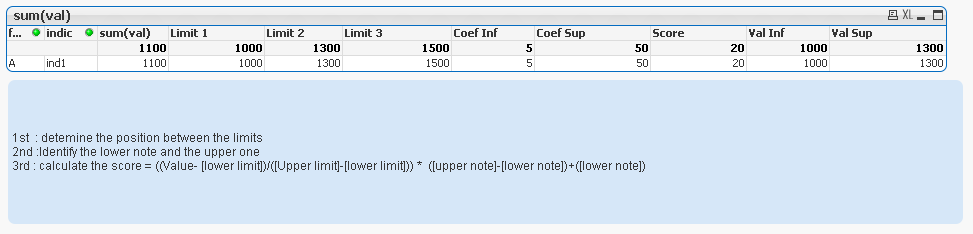
I need to use this in order to calculate a score for my providers
the slice will give me the minimum / maximum note for my provider then i have to apply a formula in order to determine the accurate note
you can find attached one Sample
- Mark as New
- Bookmark
- Subscribe
- Mute
- Subscribe to RSS Feed
- Permalink
- Report Inappropriate Content
Philippe,
I cannot open your qvw file because I have the personal Edition.
To compute the score, I would do it in the script. Sth like:
TempData:
LOAD Month,
Country,
Units
FROM[98796.xlsx](ooxml, embedded labels, table is Feuil1);
TableGroup:
LOAD Low,
High,
Group
FROM [98796.xlsx](ooxml, embedded labels, table is Feuil2);
TempData contain your data without the score. TableGroup contains the different steps to get the score (0-10, 10-20, 20-50 etc).
Afterwards, just need to loop on these groups and compute the score. it is a specific indicator that you will be able to sum, count, .....
for i = 0 to NoOfRows('TableGroup')-1
//the numbers contain , and spaces
//because they will be interpreted as text in WHERE clause, transform them the english way
let vLow= replace(replace(peek('Low', i, 'TableGroup'), ',', '.'), ' ', '');
let vHigh= replace(replace(peek('High', i, 'TableGroup'), ',', '.'), ' ', '');
//compute the score
Data:
Load *,
$(i)+1+(Units-$(vLow))/($(vHigh)-$(vLow)) as Score
RESIDENT TempData
WHERE Units > $(vLow) AND Units <= $(vHigh) ;
Next i
let vHigh=;
let vLow=;
drop table TempData;
Hope this helps
Fabrice