Unlock a world of possibilities! Login now and discover the exclusive benefits awaiting you.
- Qlik Community
- :
- All Forums
- :
- QlikView App Dev
- :
- FirstSortedValue from two sources
- Subscribe to RSS Feed
- Mark Topic as New
- Mark Topic as Read
- Float this Topic for Current User
- Bookmark
- Subscribe
- Mute
- Printer Friendly Page
- Mark as New
- Bookmark
- Subscribe
- Mute
- Subscribe to RSS Feed
- Permalink
- Report Inappropriate Content
FirstSortedValue from two sources
I have a formula that uses the FirstSortedValue function that works fine as long as there is only one house that the iHeadMort comes from, but if it comes from two houses then I need some way to add the two amounts together.
=FirstSortedValue(iHeadMort,Mort_dt)
I tried something like this, but it did not work:
=FirstSortedValue(SUM(iHeadMort),Mort_dt)
Any ideas will be greatly appreciated.
- Tags:
- new_to_qlikview
- « Previous Replies
- Next Replies »
Accepted Solutions
- Mark as New
- Bookmark
- Subscribe
- Mute
- Subscribe to RSS Feed
- Permalink
- Report Inappropriate Content
Ok. Thanks. Banged my head on this for another 90 mins. Found out that i can pass an aggr() to firstsortedvalue as long as i use DISTINCT in firstsortedvalue which is undocumented and the expression editor flags but yet appears to work nonetheless. This means i can aggregate the numerator on date (so if multiple morthouses it sums as long as the date is the same) , and then take the aggregate associated with the lowest date, which is what i am aiming for. Even if it doensn't work i have just learnt something.
Please go ahead and QA the attached to see if you can find any problems.
Here is the overall update expression:
FirstSortedValue( total <Breeder_Group, Project_#> Distinct aggr(sum( iHeadMort), Project_#,Breeder_Group,Mort_dt) , Mort_dt)
/
SUM(total <Project_#> Head_Start)
- Mark as New
- Bookmark
- Subscribe
- Mute
- Subscribe to RSS Feed
- Permalink
- Report Inappropriate Content
Is this for a chart ?
You can use the same chart aggregation syntax with firstsortedvalue. Assuming House is a field in the data model try this:
FirstSortedValue(TOTAL <House> iHeadMort ,Mort_dt)
it will bring the first value of iHeadMort within each grouping of House.
- Mark as New
- Bookmark
- Subscribe
- Mute
- Subscribe to RSS Feed
- Permalink
- Report Inappropriate Content
Jonathan,
It is for a table. That sounds like it would work, but it didn't. I think its on the right track though.
- Mark as New
- Bookmark
- Subscribe
- Mute
- Subscribe to RSS Feed
- Permalink
- Report Inappropriate Content
If it is for a back end table I would try a Group by.
Thank you
Suraj
- Mark as New
- Bookmark
- Subscribe
- Mute
- Subscribe to RSS Feed
- Permalink
- Report Inappropriate Content
OK. Can you share a sample qvw ?
- Mark as New
- Bookmark
- Subscribe
- Mute
- Subscribe to RSS Feed
- Permalink
- Report Inappropriate Content
Hi Bradley,
You need something like this:
=FirstSortedValue(iHeadMort, Aggr(SUM(Mort_dt),iHeadMort))
FirstSortedValue() functions supports nested aggregation using the Aggr() function. Also, I'd recommend you to watch below video post on my blog.
http://qlikshare.com/tag/firstsortedvalue/
Cheers,
DV
www.QlikShare.com
- Mark as New
- Bookmark
- Subscribe
- Mute
- Subscribe to RSS Feed
- Permalink
- Report Inappropriate Content
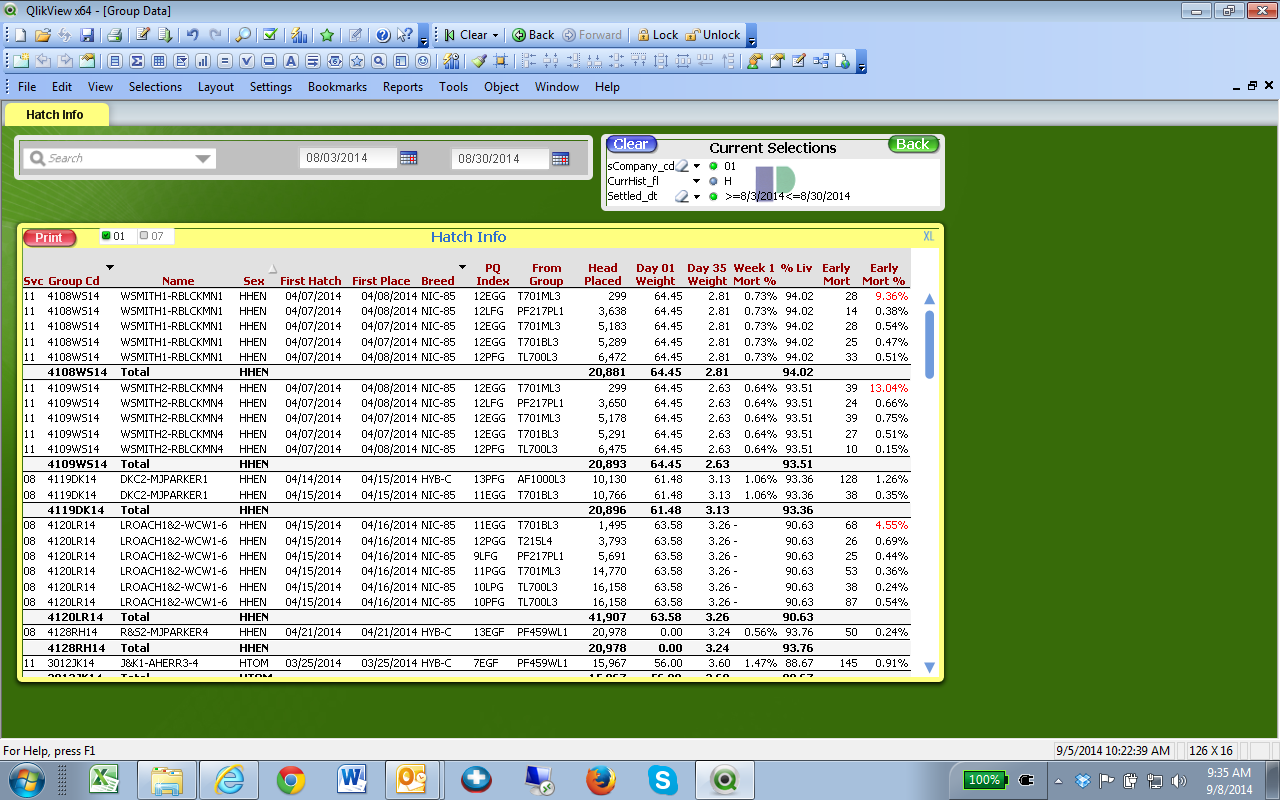
 Here is the table and a screenshot. I tried the Aggr formula from Deepak with no success. I think we are close to the solution and this is the last obstacle before this table can be published. Please help.
- Mark as New
- Bookmark
- Subscribe
- Mute
- Subscribe to RSS Feed
- Permalink
- Report Inappropriate Content
Bradley - can you tell me which field is your 'house' field ? Also I assume the expression that is incorrect is 'Week 1 Mort %' ?
Also the above approach isn't relevant because you need a combination of SUM and firstsortedvalue. The solution will likely be akin to what Deepak wrote below ...just need some more details of your model.
- Mark as New
- Bookmark
- Subscribe
- Mute
- Subscribe to RSS Feed
- Permalink
- Report Inappropriate Content
The field is house_# and yes Week 1 Mort % is the incorrect expression.
- Mark as New
- Bookmark
- Subscribe
- Mute
- Subscribe to RSS Feed
- Permalink
- Report Inappropriate Content
Hi Bradley,
I assume that you wanted to use this expression in the Pivot Table. If yes, have you tried the following expression:
FirstSortedValue(House_#, Aggr(SUM(Mort_dt), House_#, sSvcman_cd, Project_#, Group_Name, Hatch_Date, Place_Date, Breed, Condition_Code, Breeder_Group))
PS: Add one more missing dimension in the above expression which is there in your chart [S E X]. If I include in the expression it requires moderation hence I'm writing this message seperately.
It works for me!
If you need to use the expression elsewhere please let me know which chart/sheet.
Cheers,
DV
www.QlikShare.com
- « Previous Replies
- Next Replies »