Unlock a world of possibilities! Login now and discover the exclusive benefits awaiting you.
- Qlik Community
- :
- All Forums
- :
- QlikView App Dev
- :
- Floating Bars on Bar Chart
- Subscribe to RSS Feed
- Mark Topic as New
- Mark Topic as Read
- Float this Topic for Current User
- Bookmark
- Subscribe
- Mute
- Printer Friendly Page
- Mark as New
- Bookmark
- Subscribe
- Mute
- Subscribe to RSS Feed
- Permalink
- Report Inappropriate Content
Floating Bars on Bar Chart
Hi Everyone,
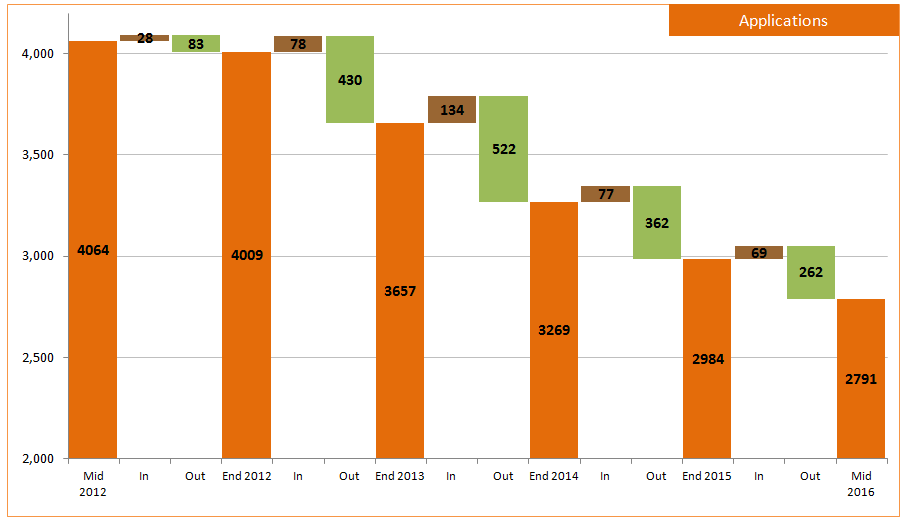
Is there a way to produce a chart like the one below where you could define the where the bottom of the bar starts?

- « Previous Replies
-
- 1
- 2
- Next Replies »
- Mark as New
- Bookmark
- Subscribe
- Mute
- Subscribe to RSS Feed
- Permalink
- Report Inappropriate Content
Another option might be to use a single dimension instead of two in grouped style.
This should resolve your issue with aligning the labels as well, without the need to use white spaces.
- Mark as New
- Bookmark
- Subscribe
- Mute
- Subscribe to RSS Feed
- Permalink
- Report Inappropriate Content
Thanks guys. I may not have the number of bars. Which means that I would have to adjust the code each time I get refreshed data. That may not be workable. Suggestions?
Stefan, What so you mean by a single dimension? I originally had date as my dimension which centered the Date vale between the three bars (Baseline, In and Out) However, my customer needs to have the In and Out labels on the dimension label line.
- Mark as New
- Bookmark
- Subscribe
- Mute
- Subscribe to RSS Feed
- Permalink
- Report Inappropriate Content
Thanks guys. I may not have the number of bars. Which means that I would have to adjust the code each time I get refreshed data. That may not be workable. Suggestions?
Hi
you may work on some aggr functions on 'Baseline' like count or sum or Rank()
so spaces or characters can be Repeated based on the RANK() !!?
May not be related to this kind but ,can be helpful...!!!
Dual(Country & '-' &Num(sum(Sales), '#,##0') &Repeat(chr(13)&chr(10), rank(Sum(Sales))-6),sum(Sales))
- Mark as New
- Bookmark
- Subscribe
- Mute
- Subscribe to RSS Feed
- Permalink
- Report Inappropriate Content
This is how you can control the labelling with a single dimension (I assumed you were using two dimensions, so my answer was probably confusing).
Pro, no need for white space magic, i.e. if you select some Dim1 or resize your chart, the labelling should still stay correct below the bars.
Con, you can select any number of bars, so you might want to make this chart readonly and let the user select in Dim1 list box.
- Mark as New
- Bookmark
- Subscribe
- Mute
- Subscribe to RSS Feed
- Permalink
- Report Inappropriate Content
This is amazing. But one other issue I see is that all the bars are equiv distant from each other. The grouping effect we had earlier is not there. Is that something which can be possible be done Stefan?
- Mark as New
- Bookmark
- Subscribe
- Mute
- Subscribe to RSS Feed
- Permalink
- Report Inappropriate Content
Hm, I think there is no easy way to do this. You can create a fourth dummy Dim2 value with basically a zero bar, but then the gap would be quite large.
But IMHO, I like it this way even better (and it's closer to the image posted in the OP), because then IN and OUT would nicely build a bridge between the year bars.
- « Previous Replies
-
- 1
- 2
- Next Replies »