Unlock a world of possibilities! Login now and discover the exclusive benefits awaiting you.
- Qlik Community
- :
- All Forums
- :
- QlikView App Dev
- :
- Forecasting
- Subscribe to RSS Feed
- Mark Topic as New
- Mark Topic as Read
- Float this Topic for Current User
- Bookmark
- Subscribe
- Mute
- Printer Friendly Page
- Mark as New
- Bookmark
- Subscribe
- Mute
- Subscribe to RSS Feed
- Permalink
- Report Inappropriate Content
Forecasting
Hi
I need some help please on this dummy problem.
I am trying to forecast the units we need to order in the forthcoming period (future) or any given period selected by tier band using what we have historically sold against the budget (future e.g. Aug 2017). Problem - my calc works on units sold historically but does not work against future budget.
Note 1, Sales & Budget = Units
Note 2, the sales achieved is tiered (using cost of packages sold) e.g. low, vlow etc but the target/budget is not tiered. It is the budget that has to be allocated that needs to be achieved for any given period to track performance/kpis
Note 3, I am using the % share that each tier band achieved for any given period and the budget for any given period to determine the number of units each tier band should be, so the result of each tier band is breakdowning the target/budget for any given period that is selected
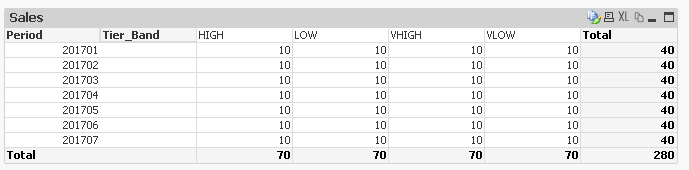
The below shows the sales made to date by tier band. So we have sold a total of 40 units, which is broken down by tier band:-
This table shows the % share of each sale to the tiers. This is what I am using to forecast units by tiers for future targets allocated.

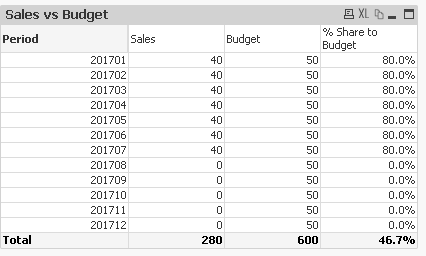
This table shows the budget allocated by month along with the sales already done. The % share is irrelevant here as we just use this to track performance on what was sold to what was allocated but I am using the units allocated on the budget. It is just to show correlation between the months
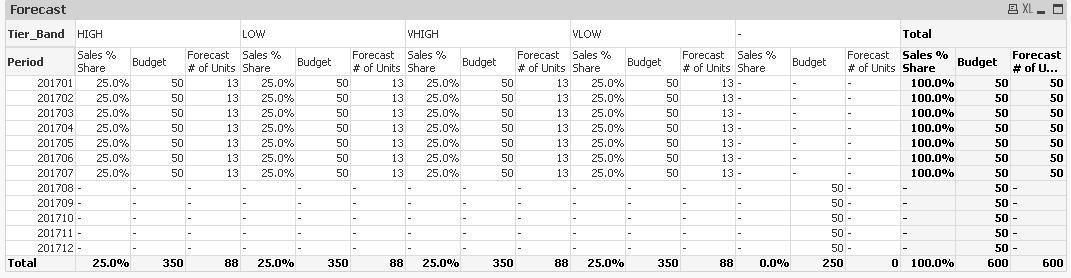
This is the final output. As can be seen below The total budget for each month is 50, which it has allocated for each tier, multiplying each tier in that month by 25% (10 units sold) to get 13 units for each tier which totals to 50. This works up until this point. Because sales has not happened from Aug 2017, the calc falls away. I want to use any period, historically or future in order to forecast by selecting a month or more than one.
I have attached the QV model as well.
Assistance on this would be appreciated 🙂
- Mark as New
- Bookmark
- Subscribe
- Mute
- Subscribe to RSS Feed
- Permalink
- Report Inappropriate Content
I am doing some research myself. Would ApplyMap function not work here?
So tier bands are not in the budget file only sales file.......??
- Mark as New
- Bookmark
- Subscribe
- Mute
- Subscribe to RSS Feed
- Permalink
- Report Inappropriate Content
Hi,
as far as i know, Tier Bands required in BUDGET table to plot the proper number on Pivot.
Thanks,
Varun
- Mark as New
- Bookmark
- Subscribe
- Mute
- Subscribe to RSS Feed
- Permalink
- Report Inappropriate Content
Thanx but we don't split our targets by tier bands. The tier bands are created in units sold which is based on the package value. The tier bands % share is derived in the sales table and used to breakdown the allocated budget so that we can order what is popular. The data provided is dummy data. If the higher tier band has a higher % weighting we would order more units of this than the lower tier band.
The tier band is a methodology we are using to forecast how many units we must order in the future based on the total budget allocated for any given period, the final output we would not view by tier, we just want to use the % share by tier to breakdown the target so that that the correct number of units is order by tier.
Targets are set separately to this and to break the budget down by tier would be difficult as the % share to each tier would move/change depending on the number of historical periods you use. I don't want to do any hard coding on the budgets if the % share keeps changing (the source is from a Microsoft SQL table converted to qvd) and the sales data is from Oracle SQL (converted to qvd).
Hope that makes sense.
- Mark as New
- Bookmark
- Subscribe
- Mute
- Subscribe to RSS Feed
- Permalink
- Report Inappropriate Content
Hi Varun
Actually did a test and put the tier bands into the budget table. This does not sort out the issue. It is because the Periods are linked together and the % share for each tier we are using is sales that has happened. If I select a period that has not happened then it does not calculate, it only works if period exists.
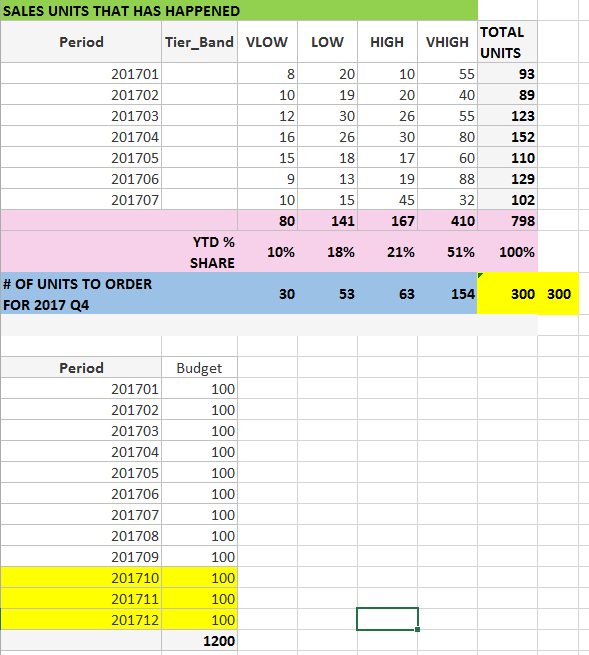
I am need to use future months which is based on targets to come in order to order the x amount of units for each tier band e.g if 2017 Q4 total target is 300 (yellow) and total sales of units YTD is as follows by tiers (pink) and % share to each then calc is
300 * 10% = 30 units to order that fall in VLOW tier band
300* 18% = 53 units to order that fall in LOW tier band etc
- Mark as New
- Bookmark
- Subscribe
- Mute
- Subscribe to RSS Feed
- Permalink
- Report Inappropriate Content
Now that I understand what applymap function does this will not work 