Unlock a world of possibilities! Login now and discover the exclusive benefits awaiting you.
- Qlik Community
- :
- All Forums
- :
- QlikView App Dev
- :
- Forecasts using manual entries
Options
- Subscribe to RSS Feed
- Mark Topic as New
- Mark Topic as Read
- Float this Topic for Current User
- Bookmark
- Subscribe
- Mute
- Printer Friendly Page
Turn on suggestions
Auto-suggest helps you quickly narrow down your search results by suggesting possible matches as you type.
Showing results for
Anonymous
Not applicable
2018-02-21
06:19 AM
- Mark as New
- Bookmark
- Subscribe
- Mute
- Subscribe to RSS Feed
- Permalink
- Report Inappropriate Content
Forecasts using manual entries
Hi All,
I currently have the following graph:
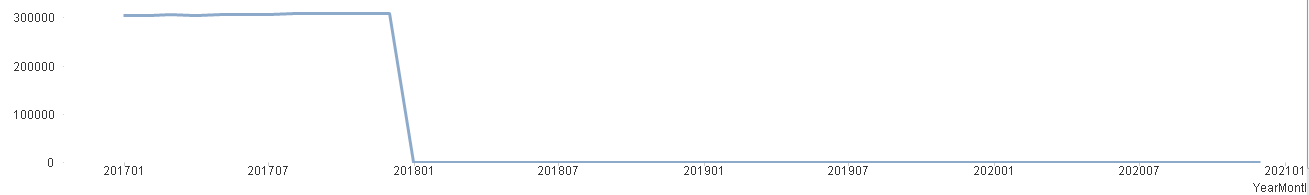
But what I would like to get is a graph that allows me to put manual entries using variables into certain years (future) to show a future forecast/goal. This will then allow the end customer to plan they future years and what the goal is each year. Hopefully somethihng like below.

Can anyone help with this
398 Views
0 Replies