Unlock a world of possibilities! Login now and discover the exclusive benefits awaiting you.
- Qlik Community
- :
- All Forums
- :
- QlikView App Dev
- :
- Formatting Bar Chart
- Subscribe to RSS Feed
- Mark Topic as New
- Mark Topic as Read
- Float this Topic for Current User
- Bookmark
- Subscribe
- Mute
- Printer Friendly Page
- Mark as New
- Bookmark
- Subscribe
- Mute
- Subscribe to RSS Feed
- Permalink
- Report Inappropriate Content
Formatting Bar Chart
I have two things that I need to do with this bar chart .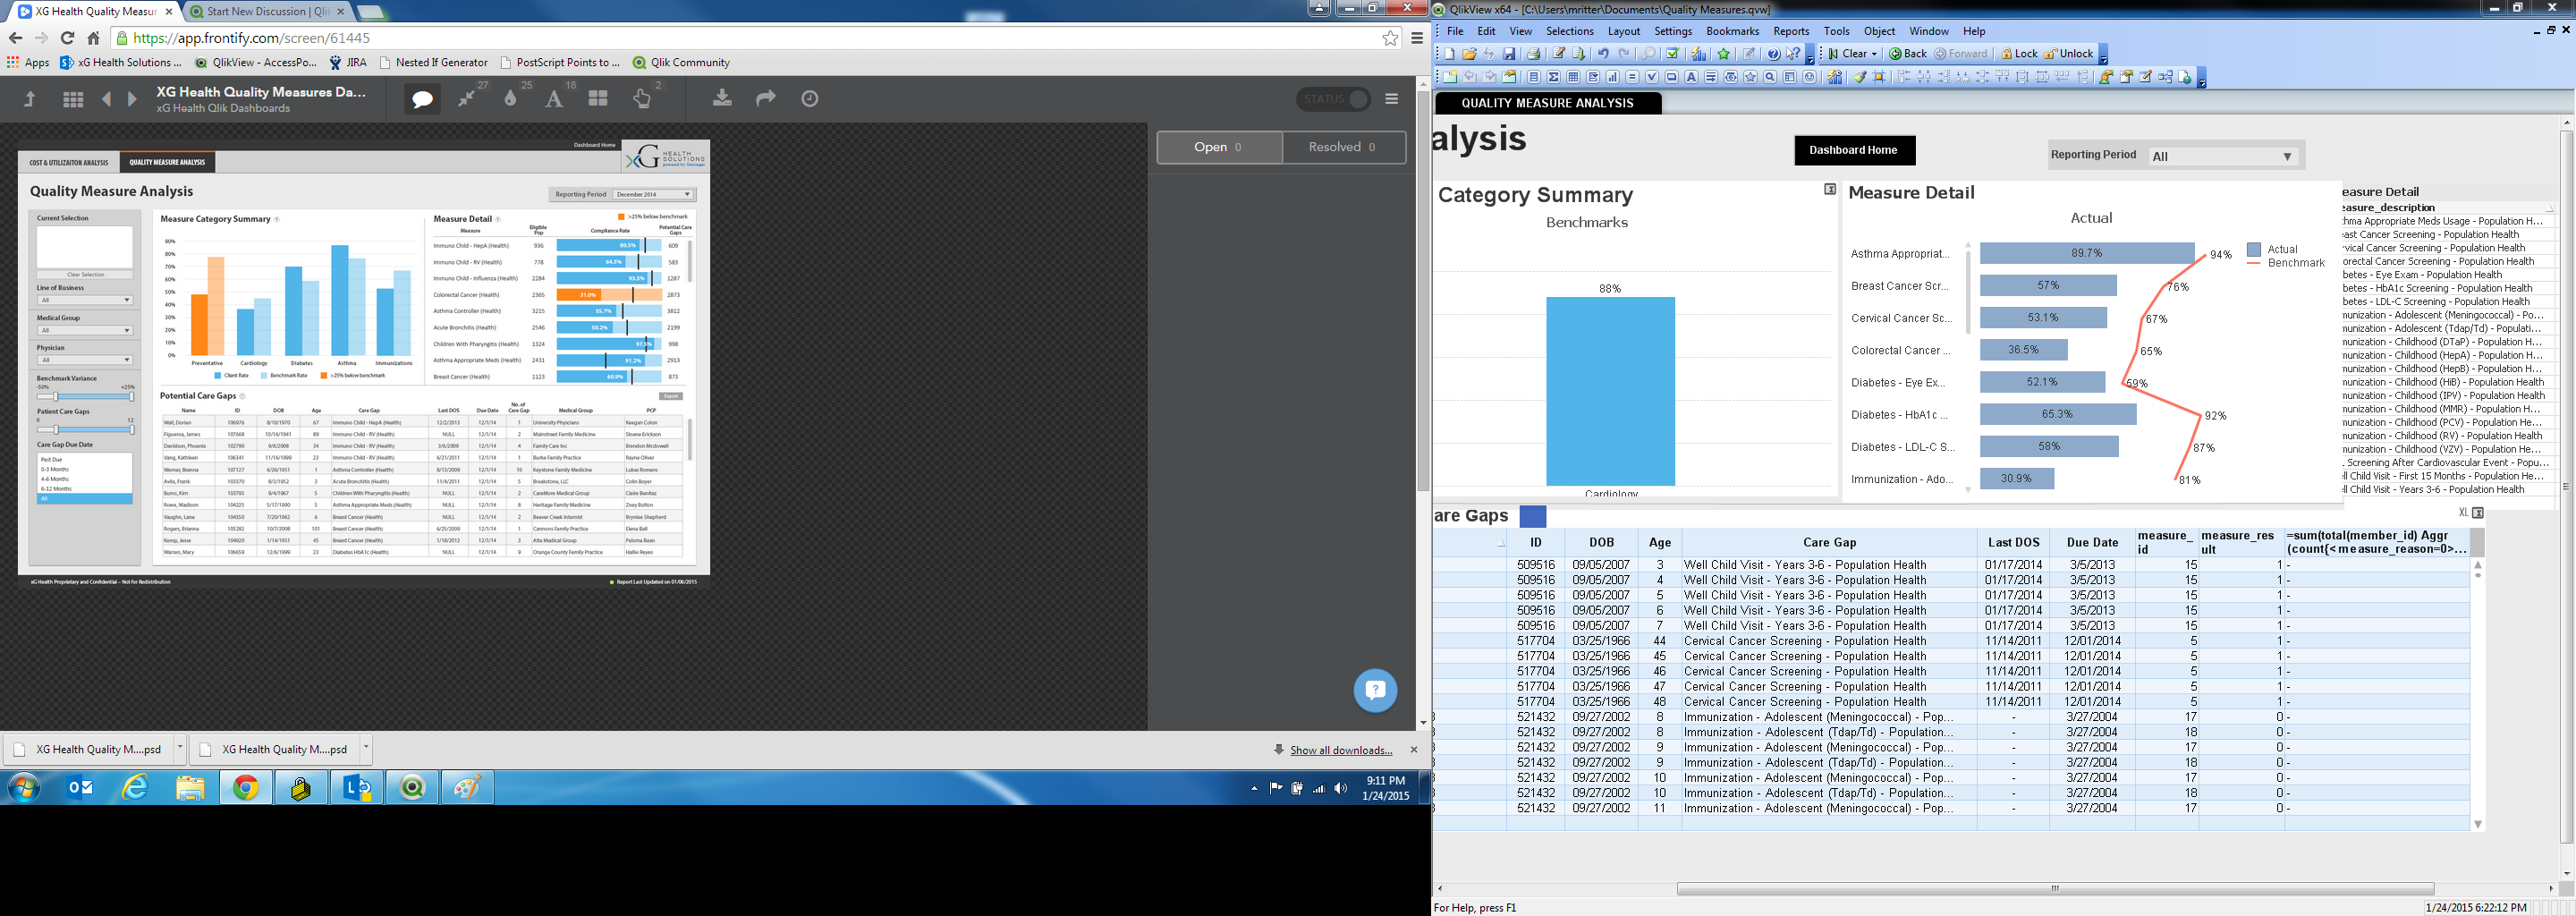
I don't know how to put the light blue background behind each line. This is not attached to any data. Just for looks.
Also, I have not been able to figure out how to create the black lines on each bar. This is attached to data. I can create a multi box and create a line showing this data (red line). But it is continuous and runs from top to bottom of chart. Can the black lines be created this way?
- Tags:
- new_to_qlikview
- Mark as New
- Bookmark
- Subscribe
- Mute
- Subscribe to RSS Feed
- Permalink
- Report Inappropriate Content
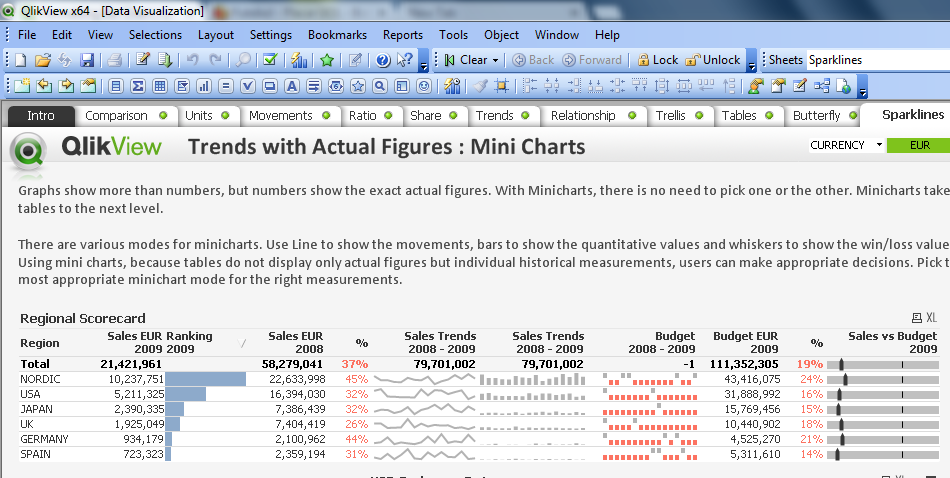
Probably, the bars with blue backgound and black lines that you are referring to, is not a bar chart, It is 'Linear Gauge' type minichart in a straight table.
- Mark as New
- Bookmark
- Subscribe
- Mute
- Subscribe to RSS Feed
- Permalink
- Report Inappropriate Content
Please check your "Data Visualization" application (comes with default instalation), the last one on right should help you