Unlock a world of possibilities! Login now and discover the exclusive benefits awaiting you.
- Qlik Community
- :
- All Forums
- :
- QlikView App Dev
- :
- Formatting Pop-Up Labels on Graphs
- Subscribe to RSS Feed
- Mark Topic as New
- Mark Topic as Read
- Float this Topic for Current User
- Bookmark
- Subscribe
- Mute
- Printer Friendly Page
- Mark as New
- Bookmark
- Subscribe
- Mute
- Subscribe to RSS Feed
- Permalink
- Report Inappropriate Content
Formatting Pop-Up Labels on Graphs
Hi,
I have a stacked bar chart, where I am displaying the percentages on the graphs, with no decimal points. The percentages are shown below.
| Quartile | Percentage | Numerator | Denominator |
| Over 75th | 25% | 13 | 51 |
| 75th | 25% | 13 | 51 |
| 50th | 20% | 10 | 51 |
| 25th | 29% | 15 | 51 |
If a user, adds the four rounded percentages together, it looks like the graph only adds up to 99%. However, it is really 100% when the decimal places are included.
Due to space limitations, I do not want to display any decimal places on the graph. However, I would like to display the extended decimals on the pop-up label that appears when the mouse hovers over each of the stacks of the graph. Is there a way to show the extended decimals in the pop-up labels without showing the decimal places on the graph?
Thank You!
Accepted Solutions
- Mark as New
- Bookmark
- Subscribe
- Mute
- Subscribe to RSS Feed
- Permalink
- Report Inappropriate Content
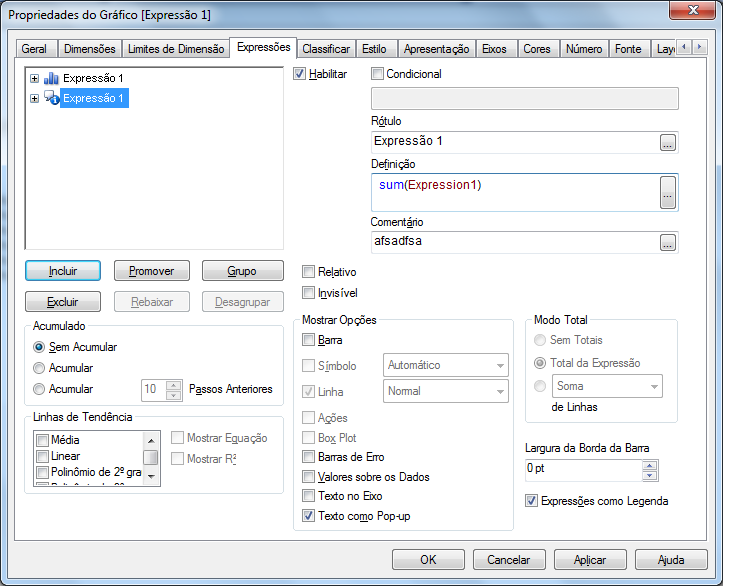
A possible trick is duplicate your expression, unmark the "bar" option and mark only "pop-up"
- Mark as New
- Bookmark
- Subscribe
- Mute
- Subscribe to RSS Feed
- Permalink
- Report Inappropriate Content
A possible trick is duplicate your expression, unmark the "bar" option and mark only "pop-up"
- Mark as New
- Bookmark
- Subscribe
- Mute
- Subscribe to RSS Feed
- Permalink
- Report Inappropriate Content
Thanks for your help!