Unlock a world of possibilities! Login now and discover the exclusive benefits awaiting you.
- Qlik Community
- :
- All Forums
- :
- QlikView App Dev
- :
- Formula Help
- Subscribe to RSS Feed
- Mark Topic as New
- Mark Topic as Read
- Float this Topic for Current User
- Bookmark
- Subscribe
- Mute
- Printer Friendly Page
- Mark as New
- Bookmark
- Subscribe
- Mute
- Subscribe to RSS Feed
- Permalink
- Report Inappropriate Content
Formula Help
I am going to try my best to articulate what it is I am struggling with. I have a straight table that shows credits and non credits what I am trying to do is create a formula that would add up the credits for a total $ as well as the same for non credits and then present a third dimension as a percentage of the two.
For example: % of total credits compared to total sales $ "Basically credits as a percentage of total sales." The problem is that the both the credits and sales are in the same table field. I have been racking my brain on this one and I am sure it is something simple.
Any help would be greatly appreciated.
- Tags:
- qlikview_scripting
- « Previous Replies
-
- 1
- 2
- Next Replies »
Accepted Solutions
- Mark as New
- Bookmark
- Subscribe
- Mute
- Subscribe to RSS Feed
- Permalink
- Report Inappropriate Content
It's a little hard without example data to work with, but guessing you need something like this: sum({<Amount={">0"}>} Sales)/sum(Sales)
Or if you have an indicator that something is a "credit" then sum({<Credit={'Y'}>} Sales)/sum(Sales)
Vlad
- Mark as New
- Bookmark
- Subscribe
- Mute
- Subscribe to RSS Feed
- Permalink
- Report Inappropriate Content
Thanks I will give it a shot and let you know how it works out.
- Mark as New
- Bookmark
- Subscribe
- Mute
- Subscribe to RSS Feed
- Permalink
- Report Inappropriate Content
No luck but thanks anyways Vlad.
- Mark as New
- Bookmark
- Subscribe
- Mute
- Subscribe to RSS Feed
- Permalink
- Report Inappropriate Content
Hi Robert,
Can you share a sample data or screenshot, it will make easy for us to understand.
Regards
KC
KC
- Mark as New
- Bookmark
- Subscribe
- Mute
- Subscribe to RSS Feed
- Permalink
- Report Inappropriate Content
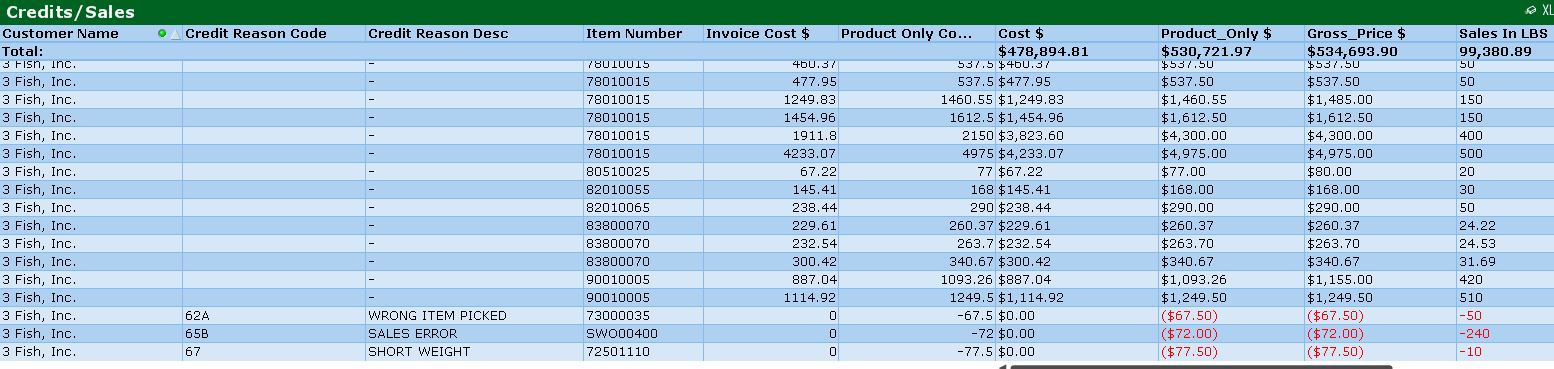
What I need to do is create three additional expressions, one that shows the total sales excluding the credits, another showing the credits only, and a third that calculates the percentage between the two.
Essentially what I need to know is the % of credits compared to total sales across multiple dimensions.,
- Mark as New
- Bookmark
- Subscribe
- Mute
- Subscribe to RSS Feed
- Permalink
- Report Inappropriate Content
- Mark as New
- Bookmark
- Subscribe
- Mute
- Subscribe to RSS Feed
- Permalink
- Report Inappropriate Content
Sorry I tried attaching the picture in the first reply.
- Mark as New
- Bookmark
- Subscribe
- Mute
- Subscribe to RSS Feed
- Permalink
- Report Inappropriate Content
What I have is a single dataset showing both positive and negative numbers, what I am trying to accomplish is the creation of two expressions. One showing all of the positive numbers and the second showing the negative numbers. I have been playing with the syntax but can’t seem to get it right.
- Mark as New
- Bookmark
- Subscribe
- Mute
- Subscribe to RSS Feed
- Permalink
- Report Inappropriate Content
If you have the 2 "credit reason" columns in your chart, then you'd need to aggregate away from these columns in order to be able to present a single view of credits and non-credits per customer/item. You would accomplish that by using the "total" keyword in your sum. Not exactly sure which expression you had in mind, but try something like this:
Positives: sum({<Sales={">0"}>} total <[Customer Name],[Item Number]> Sales)
Negatives: sum({<Sales={"<0"}>} total <[Customer Name],[Item Number]> Sales)
Replace "Sales" with the number field you used to create "Product_Only $"
Alternatively, if you don't have the "credit reason" columns, you can get rid of "total <[Customer Name],[Item Number]"
Regards,
Vlad
- « Previous Replies
-
- 1
- 2
- Next Replies »