Unlock a world of possibilities! Login now and discover the exclusive benefits awaiting you.
- Qlik Community
- :
- All Forums
- :
- QlikView App Dev
- :
- Formula/variable inside set analysis is not calcul...
- Subscribe to RSS Feed
- Mark Topic as New
- Mark Topic as Read
- Float this Topic for Current User
- Bookmark
- Subscribe
- Mute
- Printer Friendly Page
- Mark as New
- Bookmark
- Subscribe
- Mute
- Subscribe to RSS Feed
- Permalink
- Report Inappropriate Content
Formula/variable inside set analysis is not calculating as per the dimension in straight table
Hi Guys,
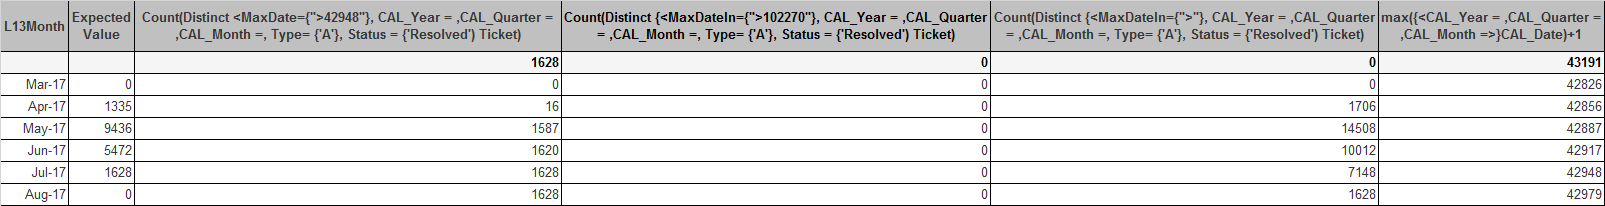
I'm making a straight table with CAL_Month as dimension and an expression to calculate the no of tickets resolved with a type 'A' and the calendar date is greater than the Maxdate using the below expression,
Count(Distinct <MaxDate={">$(=max(CAL_Date)+1)"}, CAL_Year = ,CAL_Quarter = ,CAL_Month =, Type= {'A'}, Status = {'Resolved') Ticket)
This works fine in a text box where I display the value for one month at a time (I have Year & Month filters as well in the dashboard).
But when I try to display the same value in a line chart for all months (ignoring the Month & Year selections in the dashboard) its not working fine. Because the max date is not properly calculating at CAL_Month dimension level.
I have tried below three possibilities,
Exp 2:-
Count(Distinct <MaxDate={">$(=max(CAL_Date)+1)"}, CAL_Year = ,CAL_Quarter = ,CAL_Month =, Type= {'A'}, Status = {'Resolved') Ticket)
Exp 3:-
Count(Distinct <MaxDate={">$(=max({<CAL_Year = ,CAL_Quarter = ,CAL_Month =>}CAL_Date)+1)"}, CAL_Year = ,CAL_Quarter = ,CAL_Month =, Type= {'A'}, Status = {'Resolved') Ticket)
Exp 4:-
Count(Distinct <MaxDate={">$(=aggr(max({<CAL_Year = ,CAL_Quarter = ,CAL_Month =>}CAL_Date)+1),CAL_Month)"}, CAL_Year = ,CAL_Quarter = ,CAL_Month =, Type= {'A'}, Status = {'Resolved') Ticket)
Exp 5:- Here I just pasted the max date calculation separately which is working fine, but the same is not working inside a set analysis calculation.
And these results as below,
Can you guys please help me here.
Thanks.
- « Previous Replies
-
- 1
- 2
- Next Replies »
- Mark as New
- Bookmark
- Subscribe
- Mute
- Subscribe to RSS Feed
- Permalink
- Report Inappropriate Content
It works, yes always there are only 13 values in the x-axis so this nested if's are solving my issue. Thanks, Great!!
- « Previous Replies
-
- 1
- 2
- Next Replies »