Unlock a world of possibilities! Login now and discover the exclusive benefits awaiting you.
- Qlik Community
- :
- All Forums
- :
- QlikView App Dev
- :
- Funnel Chart Dimension Problem
- Subscribe to RSS Feed
- Mark Topic as New
- Mark Topic as Read
- Float this Topic for Current User
- Bookmark
- Subscribe
- Mute
- Printer Friendly Page
- Mark as New
- Bookmark
- Subscribe
- Mute
- Subscribe to RSS Feed
- Permalink
- Report Inappropriate Content
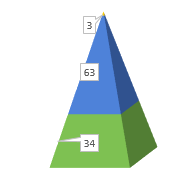
Funnel Chart Dimension Problem
Hello Friends, I am trying to create who got the more than 70 score and who got the in between 50-70 and below 50. So, here i want to calculate Percentage.
But, My funnel chart is not showing properly can any one help me please?
For 2014
>70 -- 5%
50-70 - 76%
<50 - 19%
For 2015
>70 -- 11%
50-70 - 68%
<50 - 21%
- Mark as New
- Bookmark
- Subscribe
- Mute
- Subscribe to RSS Feed
- Permalink
- Report Inappropriate Content
Hi,
Please check it..
- Mark as New
- Bookmark
- Subscribe
- Mute
- Subscribe to RSS Feed
- Permalink
- Report Inappropriate Content
Mani, I am expecting Dimension. Can i know is that Measure if correct for Average??
Like this??
- Mark as New
- Bookmark
- Subscribe
- Mute
- Subscribe to RSS Feed
- Permalink
- Report Inappropriate Content
as you see in the sample,the problem is not your funnel chart, problem is about your dimension. check and change your dimension.
- Mark as New
- Bookmark
- Subscribe
- Mute
- Subscribe to RSS Feed
- Permalink
- Report Inappropriate Content
Yes, In this if i select 2014 and Q1 it should be value of above diagram which are
>70 , >50 and <=70 & <50
Meantime, Can you please have a look of Associative. Because, when ever we click the 2014 That time Funnel chart should the Data of 2014 and this time while i am checking the name from list box, Those two values are not removed. I want to exclude two elements. Those are "Key Message Delivery" and "Sales Objective Delivery"
- Mark as New
- Bookmark
- Subscribe
- Mute
- Subscribe to RSS Feed
- Permalink
- Report Inappropriate Content
I could not understand your meaning. please explain more. but two name "Key Message Delivery" and "Sales Objective category" is not calculated in chart. because when you select from list box the chart get black color.
- Mark as New
- Bookmark
- Subscribe
- Mute
- Subscribe to RSS Feed
- Permalink
- Report Inappropriate Content
Here, Please select 2014 Data and see the Score Values, Because the score values should be 100 below, Then the percentage is Similar to above which i mentioned before image.
Can you please help me, Meantime Can i know what is the Insight of that Diagram?