Unlock a world of possibilities! Login now and discover the exclusive benefits awaiting you.
- Qlik Community
- :
- All Forums
- :
- QlikView App Dev
- :
- Gauge Chart Object
- Subscribe to RSS Feed
- Mark Topic as New
- Mark Topic as Read
- Float this Topic for Current User
- Bookmark
- Subscribe
- Mute
- Printer Friendly Page
- Mark as New
- Bookmark
- Subscribe
- Mute
- Subscribe to RSS Feed
- Permalink
- Report Inappropriate Content
Gauge Chart Object
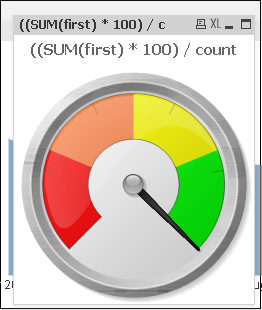
I have created a Gauge object to show our convertion rate, however it dosent show the right numbers
I have tried doing the same calulation in a pivot, and it does the calcalation correctly
the expression is:
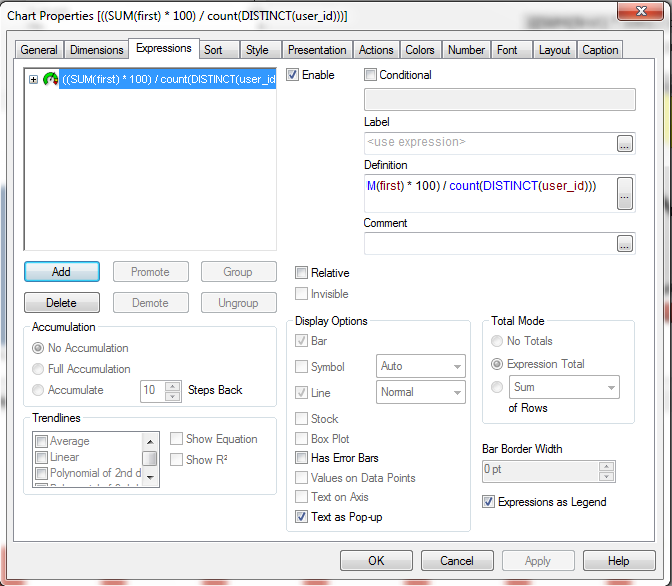
((SUM(first) * 100) / count(DISTINCT(user_id)))
first = first order (0 / 1 values)
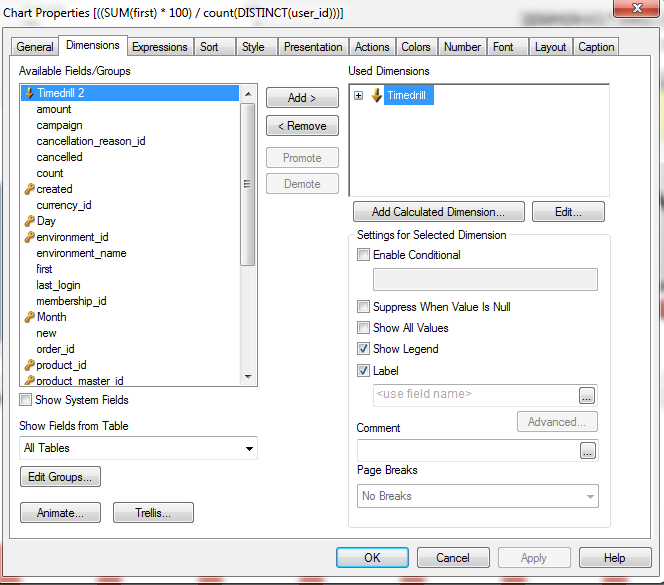
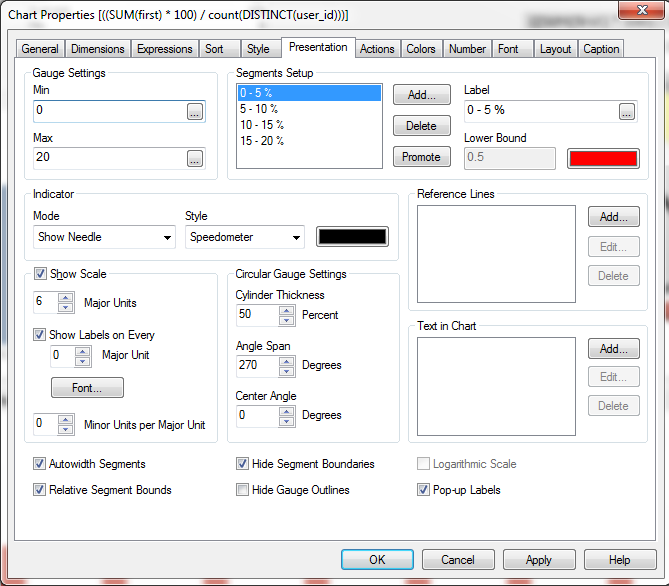
Here is a few screenshots of the settings:
Also how do I add the value showed within the gauge to the object.
Accepted Solutions
- Mark as New
- Bookmark
- Subscribe
- Mute
- Subscribe to RSS Feed
- Permalink
- Report Inappropriate Content
I solved the issue but removing the timedrill as the dimension
Thank you All!
- Mark as New
- Bookmark
- Subscribe
- Mute
- Subscribe to RSS Feed
- Permalink
- Report Inappropriate Content
What value is showing? I'm sure is showing the right value but you need to work with the MAX value of the gauge and the different lower levels. Otherwise it would be useful to post your app or just create an example and post it here.
- Mark as New
- Bookmark
- Subscribe
- Mute
- Subscribe to RSS Feed
- Permalink
- Report Inappropriate Content
But if it´s the same value, i don't understand why the pivot show the value of 10,58 and the gauge show the value of 45-50
- Mark as New
- Bookmark
- Subscribe
- Mute
- Subscribe to RSS Feed
- Permalink
- Report Inappropriate Content
I see that the "Lower Bound" says 0.5. I don't think that's right. You should work on those values...
- Mark as New
- Bookmark
- Subscribe
- Mute
- Subscribe to RSS Feed
- Permalink
- Report Inappropriate Content
I solved the issue but removing the timedrill as the dimension
Thank you All!