Unlock a world of possibilities! Login now and discover the exclusive benefits awaiting you.
- Qlik Community
- :
- All Forums
- :
- QlikView App Dev
- :
- Generating Line Chart from Excel and like Excel
- Subscribe to RSS Feed
- Mark Topic as New
- Mark Topic as Read
- Float this Topic for Current User
- Bookmark
- Subscribe
- Mute
- Printer Friendly Page
- Mark as New
- Bookmark
- Subscribe
- Mute
- Subscribe to RSS Feed
- Permalink
- Report Inappropriate Content
Generating Line Chart from Excel and like Excel
Hi,
i tried to publish Excel data in QlikView in the same way as the Excel line chart. I found no way to generate fix colums for every year in Qlikview like in Excel. 
The only way i found is to display the data when converting the Excel source in the following way. Then the you can define the x-axis as "YEAR" and the it works.
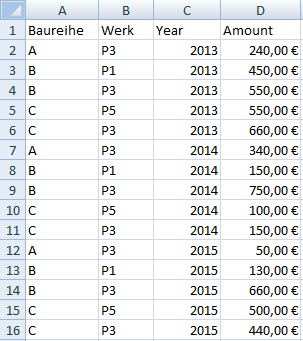
But I don't want to change the original Excel file source. Has anybody a idea for a solution? Perhaps it's easy, but I started evaluating QlikView yesterday.
Best regards,
Stefan
Accepted Solutions
- Mark as New
- Bookmark
- Subscribe
- Mute
- Subscribe to RSS Feed
- Permalink
- Report Inappropriate Content
Thank you for your help,
the funktion CROSSTABLE solves the problem.
Stefan
- Mark as New
- Bookmark
- Subscribe
- Mute
- Subscribe to RSS Feed
- Permalink
- Report Inappropriate Content
Hi Stefan,
Create a new field which is a combination of Baureihe and Werk.
Like shown below.
Load Baureihe&' '& Werk as New_Field,
Baureihe,
Werk,
Year,
Amount
From XYZ;
Now create Bar Chart with two dimensions.
1. Year
2. New_Field
and expression as
Sum(Amount)
Change style to Stake chart.
Regards,
Kaushik Solanki
- Mark as New
- Bookmark
- Subscribe
- Mute
- Subscribe to RSS Feed
- Permalink
- Report Inappropriate Content
Hi,
To my mind what I would do during importing of the Excel file is to use TRANSFORMATION.
With transformation you load the data into QV as you wanted.
Let me know if this helps
Regards,
gabriel
- Mark as New
- Bookmark
- Subscribe
- Mute
- Subscribe to RSS Feed
- Permalink
- Report Inappropriate Content
Thank you for your help,
the funktion CROSSTABLE solves the problem.
Stefan