Unlock a world of possibilities! Login now and discover the exclusive benefits awaiting you.
- Qlik Community
- :
- All Forums
- :
- QlikView App Dev
- :
- Geometric Shape and Click
- Subscribe to RSS Feed
- Mark Topic as New
- Mark Topic as Read
- Float this Topic for Current User
- Bookmark
- Subscribe
- Mute
- Printer Friendly Page
- Mark as New
- Bookmark
- Subscribe
- Mute
- Subscribe to RSS Feed
- Permalink
- Report Inappropriate Content
Geometric Shape and Click
Hi friends,
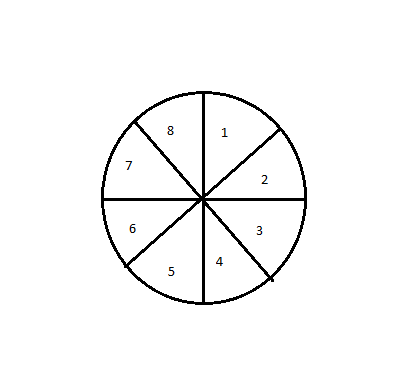
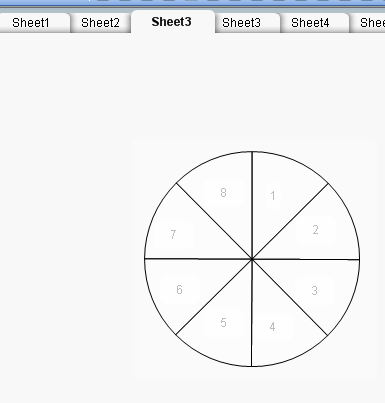
I have a circle image in text Object which is divided into 8 halves as shown below on clicking on each halves it should take to respective sheets
- Mark as New
- Bookmark
- Subscribe
- Mute
- Subscribe to RSS Feed
- Permalink
- Report Inappropriate Content
One from The Silly Tricks Department: see attached qvw
Pro tip: Folks don't do this in production dashboards. It's bad UX.
talk is cheap, supply exceeds demand
- Mark as New
- Bookmark
- Subscribe
- Mute
- Subscribe to RSS Feed
- Permalink
- Report Inappropriate Content
Hi Manoj,
follow the below steps to solve your problem:
1) Create inline table with below script:
LOAD * INLINE [
Sheet Number
1
2
3
4
5
6
7
8
];
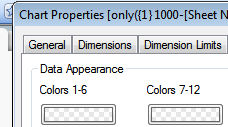
2) Create pie chart with dimension = [Sheet Number] and expression = only({1} 1000-[Sheet Number])
3) Go to the colour tab and change the slice colour to white with little bit transparent.
4) Create 8 text boxes with number 1-8 and keep that at bottom layer and keep your pi chart at the top level.
5)Go to the document property-->Trigger-->field event triggers-->select sheet number-->on select-->edit action
-->Layout-->Active Sheet-->
=if(GetFieldSelections([Sheet Number])=1,'SH01',
if(GetFieldSelections([Sheet Number])=2,'SH02',
if(GetFieldSelections([Sheet Number])=3,'SH03',
if(GetFieldSelections([Sheet Number])=4,'SH04',
if(GetFieldSelections([Sheet Number])=5,'SH05',
if(GetFieldSelections([Sheet Number])=6,'SH06',
if(GetFieldSelections([Sheet Number])=7,'SH07',
if(GetFieldSelections([Sheet Number])=8,'SH08'))))))))
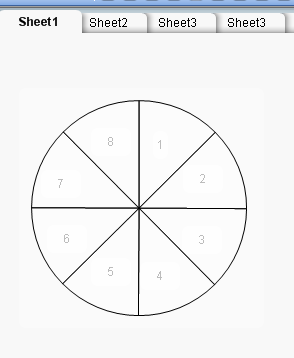
5)Your output will be:
When Sheet one is Active:
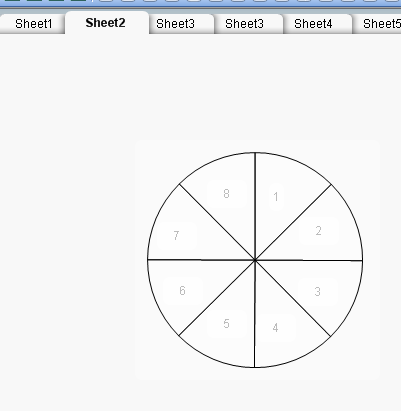
Now click on Slice 2 output will be:
Now click on Slice 3 output will be:
I hope this will help you........