Unlock a world of possibilities! Login now and discover the exclusive benefits awaiting you.
- Qlik Community
- :
- All Forums
- :
- QlikView App Dev
- :
- Get dimension values in Pivot Chart Expression
- Subscribe to RSS Feed
- Mark Topic as New
- Mark Topic as Read
- Float this Topic for Current User
- Bookmark
- Subscribe
- Mute
- Printer Friendly Page
- Mark as New
- Bookmark
- Subscribe
- Mute
- Subscribe to RSS Feed
- Permalink
- Report Inappropriate Content
Get dimension values in Pivot Chart Expression
I have a dataset with two dimensions
Dimension 1 = A and It has values A1,A2, A3
Dimension 2 = B and it has values B1, B2
If I do a pivot chart using those two dimensions I would get something like this
| B1 | B2 | |
|---|---|---|
| A1 | ||
| A2 | ||
| A3 |
In expression of that Pivot Chart, I want to refer to the Column Headers and Row Headers so that I can get something like this
| B1 | B2 | |
|---|---|---|
| A1 | A1B1 | A1B2 |
| A2 | A2B1 | A2B2 |
| A3 | A3B1 | A3B2 |
Can you suggest how to refer to the column header in the expression?
- « Previous Replies
-
- 1
- 2
- Next Replies »
- Mark as New
- Bookmark
- Subscribe
- Mute
- Subscribe to RSS Feed
- Permalink
- Report Inappropriate Content
A1 A2 A3
A1 A1A1 A1A2 A1A3
A2 A2A1 A2A2 A2,A3
A3 A3A1 A3A2 A3A3
- Mark as New
- Bookmark
- Subscribe
- Mute
- Subscribe to RSS Feed
- Permalink
- Report Inappropriate Content
I don't want numbers. I want text only.
I want to display value of column header and row header in each intersection
- Mark as New
- Bookmark
- Subscribe
- Mute
- Subscribe to RSS Feed
- Permalink
- Report Inappropriate Content
I was able to solve this.. But i have more questions..
How do I upload my qlikview file so that I show you where I am facing issues.
- Mark as New
- Bookmark
- Subscribe
- Mute
- Subscribe to RSS Feed
- Permalink
- Report Inappropriate Content
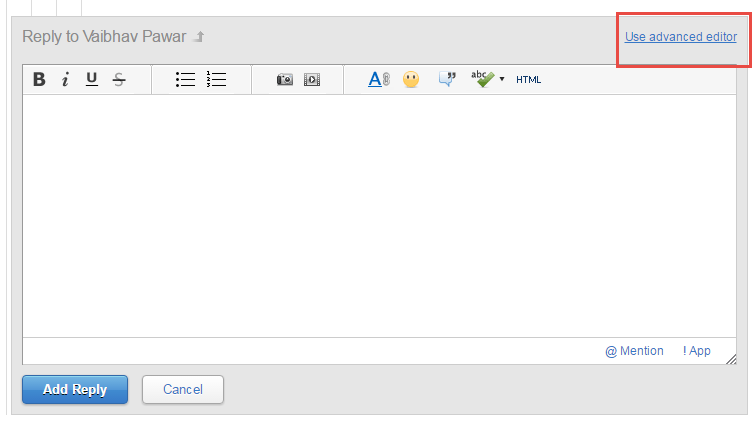
When you click on reply, you can see a link on top right corner of that reply window that says "use advanced editor" once you click on that you can use an attach icon in bottom right corner for uploads!!!
- Mark as New
- Bookmark
- Subscribe
- Mute
- Subscribe to RSS Feed
- Permalink
- Report Inappropriate Content
I don't see that option. Is it browser specific?
- Mark as New
- Bookmark
- Subscribe
- Mute
- Subscribe to RSS Feed
- Permalink
- Report Inappropriate Content
- Mark as New
- Bookmark
- Subscribe
- Mute
- Subscribe to RSS Feed
- Permalink
- Report Inappropriate Content
- Mark as New
- Bookmark
- Subscribe
- Mute
- Subscribe to RSS Feed
- Permalink
- Report Inappropriate Content
What is the expected output for this sample?
- Mark as New
- Bookmark
- Subscribe
- Mute
- Subscribe to RSS Feed
- Permalink
- Report Inappropriate Content
@Sunny T Expected output is to see expression calculated for each row and column intersection. similar to Pivot 1
- Mark as New
- Bookmark
- Subscribe
- Mute
- Subscribe to RSS Feed
- Permalink
- Report Inappropriate Content
The problem is that set analysis is evaluated once per chart and what you need is to use Aggr() function somehow to get what you want. But again, I am not sure I know what the final table will look like in respect to numbers to offer a better suggestion here.
- « Previous Replies
-
- 1
- 2
- Next Replies »