Unlock a world of possibilities! Login now and discover the exclusive benefits awaiting you.
- Qlik Community
- :
- All Forums
- :
- QlikView App Dev
- :
- Getting error in block chart of positive and negat...
- Subscribe to RSS Feed
- Mark Topic as New
- Mark Topic as Read
- Float this Topic for Current User
- Bookmark
- Subscribe
- Mute
- Printer Friendly Page
- Mark as New
- Bookmark
- Subscribe
- Mute
- Subscribe to RSS Feed
- Permalink
- Report Inappropriate Content
Getting error in block chart of positive and negative values in chart
Hi all,
I am trying to show the top and bottom 10 sales in block chart .For top 10 it is working as expected but for bottom 10 it is now working correctly.
I have + and - values both in sales field.
Getting error positive and negative values in chart.
I have tried using fabs and dual both not getting correct result.
Any help on this?
Attached sample app.
regards,
Mayank
- Mark as New
- Bookmark
- Subscribe
- Mute
- Subscribe to RSS Feed
- Permalink
- Report Inappropriate Content
Try this
sum(fabs(ABC_QTY))
- Mark as New
- Bookmark
- Subscribe
- Mute
- Subscribe to RSS Feed
- Permalink
- Report Inappropriate Content
Hi Settu,
Thank you for the reply.
I am not getting correct values with the above expression.Reason is When take smallest 10 value for customers:
Below is the value I am getting:So ideally this 10 customer should come for bottom 10.
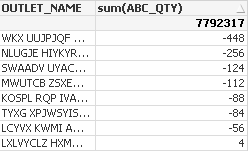
I am using dimension limit 10 for smallest.
let me know in case of any questions.
Regards,
Mayank