Unlock a world of possibilities! Login now and discover the exclusive benefits awaiting you.
- Qlik Community
- :
- All Forums
- :
- QlikView App Dev
- :
- Getting expression to display all months for only ...
- Subscribe to RSS Feed
- Mark Topic as New
- Mark Topic as Read
- Float this Topic for Current User
- Bookmark
- Subscribe
- Mute
- Printer Friendly Page
- Mark as New
- Bookmark
- Subscribe
- Mute
- Subscribe to RSS Feed
- Permalink
- Report Inappropriate Content
Getting expression to display all months for only one year
Hi Qlik Community,
I'm yet again requesting your help. 
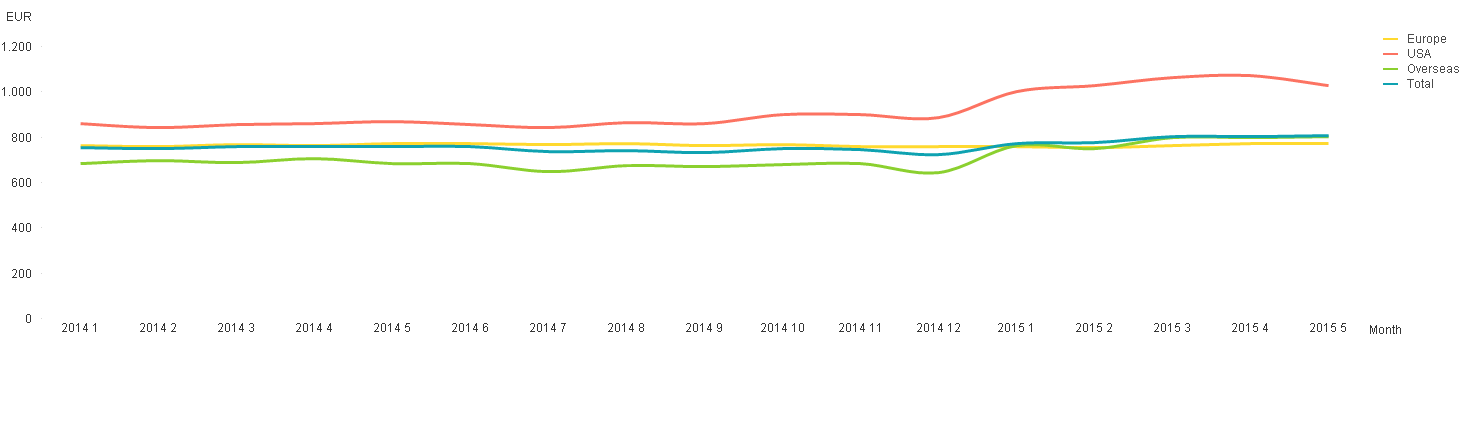
I have a line graph with four expressions (Europe, International, USA, Total) and one dimension (YearMonth).
Expressions are mostly the same except for the markets that I want in each displayable line. In example:
For USA:
Sum({<Year={$(=max(Year)), $(=max(Year)-1)}, MarketCd={'USA'}>}Sales)
What I need is to display all month data for 2014 and be able to choose the months I want for 2015 using list boxes.
I need this is for a report.
What happens is: When I select one or more months, QlikView displays ONLY those months for both years. Which makes sense, I just don't know what to put in the expression to make it lock all 12 months for 2014 only. I tried using IF and using AND to combine expressions, but was unsuccessful.
I also tried this: Sum({<Year={$(=max(Year)), $(=max(Year)-1)}, Month=, MarketCd={'USA'}>}Sales)
But it locks all months for both years instead, ignoring my month selection. Which also makes sense.
What can I do? I attached an image. Please ignore the EUR axis, it is merely an example.
I cannot attach the qvw due to confidentiality.
 Thank you so much,
Mariana.
- « Previous Replies
-
- 1
- 2
- Next Replies »
- Mark as New
- Bookmark
- Subscribe
- Mute
- Subscribe to RSS Feed
- Permalink
- Report Inappropriate Content
I do.
I have a field with YearMonth together in my model. That is what I’m using as this charts’s dimension.
I will try your expression also. Thanks so much!
- Mark as New
- Bookmark
- Subscribe
- Mute
- Subscribe to RSS Feed
- Permalink
- Report Inappropriate Content
You are a genius! Your expression is perfect.
Thank you a thousand times.
Mariana.
- Mark as New
- Bookmark
- Subscribe
- Mute
- Subscribe to RSS Feed
- Permalink
- Report Inappropriate Content
Nice, try first the set analisys expression, as it's better for performance, it can be simplified a bit:
Sum({<YearMonth={">=$(=Max(Year)-1 & '01')<=$(=Max(YearMonth))"}, Year=, Month=, MarketCd={'USA'}>}Sales)
Change YearMonth using your Dimension field name. I didn't tested so maybe needs debug.
- Mark as New
- Bookmark
- Subscribe
- Mute
- Subscribe to RSS Feed
- Permalink
- Report Inappropriate Content
Good, glad to help!
- Mark as New
- Bookmark
- Subscribe
- Mute
- Subscribe to RSS Feed
- Permalink
- Report Inappropriate Content
well done Rubin
- « Previous Replies
-
- 1
- 2
- Next Replies »