Unlock a world of possibilities! Login now and discover the exclusive benefits awaiting you.
- Qlik Community
- :
- All Forums
- :
- QlikView App Dev
- :
- Google Maps API Coordinates Problem
- Subscribe to RSS Feed
- Mark Topic as New
- Mark Topic as Read
- Float this Topic for Current User
- Bookmark
- Subscribe
- Mute
- Printer Friendly Page
- Mark as New
- Bookmark
- Subscribe
- Mute
- Subscribe to RSS Feed
- Permalink
- Report Inappropriate Content
Google Maps API Coordinates Problem
Hello guys, I've implemented the Google Maps Api in my report but for some reason the "dots" which should represent the capital city of different countries ( UK, USA, Germany, India, South Africa and Canada) are not placed accordingly on the map. I have the Longitude and Latitude correct values in my excel file. Also, the thing is that when I click a dot (a city, basically), it zooms in in the correct city. For example, when I click on the dot that should represent UK, I get central London ( I've used the coordinates of each country's capital city).
So, my question is, why aren't the dots correctly placed when viewing the world map?
Thanks,
Adrian
PS: I have the free QV version, so I can't open QV documents created by other users. It would be great if you could explain me by writing rather then sending me a QV document.
- Mark as New
- Bookmark
- Subscribe
- Mute
- Subscribe to RSS Feed
- Permalink
- Report Inappropriate Content
Hi Adrian, I'm assuming you've used the scatterplot method?
Perhaps then it's not the Long and Lat of the cities, but the Long and Lat that boundary the image that you are returning as the background of the chart. They all appear a bit to the west.
How are you calculating the boundaries of the image that you are feeding back to google? Perhaps your calculation might work for lower zooms but the curvature of the earth will distort it when youa re trying to view the whole planet. In this case you need a different calculation that takes this into effect.
Erica
- Mark as New
- Bookmark
- Subscribe
- Mute
- Subscribe to RSS Feed
- Permalink
- Report Inappropriate Content
It's the first time I'm using maps api, but I'm assuming you are asking about the following:
Longitude:
=sum( round (256*pow(2,($(var_zoom)-1)))+( Longitude *((256*pow(2,$(var_zoom)))/360)))
Latitude:
=sum(((256*pow(2,($(var_zoom)-1)))+((0.5*log((1+(sin((Latitude)*pi()/180)))/(1-(sin((Latitude)*pi()/180)))))*((-256*pow(2,$(var_zoom)))/(2*pi())))))
X axis:
Static Min:
=(256*pow(2,($(var_zoom)-1)))+( var_mid_long *((256*pow(2,$(var_zoom)))/360)) -round(map_size_x/2)
Static Max:
=( (256*pow(2,($(var_zoom)-1)))+( var_mid_long *((256*pow(2,$(var_zoom)))/360)) + round(map_size_x/2))
Y axis:
Static Min:
=((256*pow(2,($(var_zoom)-1)))+((0.5*log((1+(sin(var_mid_lat*pi()/180)))/(1-(sin(var_mid_lat*pi()/180)))))*((-256*pow(2,$(var_zoom)))/(2*pi())))+round(map_size_y/2))
Static Max:
=((256*pow(2,($(var_zoom)-1)))+((0.5*log((1+(sin(var_mid_lat*pi()/180)))/(1-(sin(var_mid_lat*pi()/180)))))*((-256*pow(2,$(var_zoom)))/(2*pi())))-round(map_size_y/2))
These are all my calculations related to dimensions.
Thanks,
Adrian
- Mark as New
- Bookmark
- Subscribe
- Mute
- Subscribe to RSS Feed
- Permalink
- Report Inappropriate Content
Hi Adrian,
Everything in axis looks fine
can you check where you have un-selected forced 0 option in axis or not ,
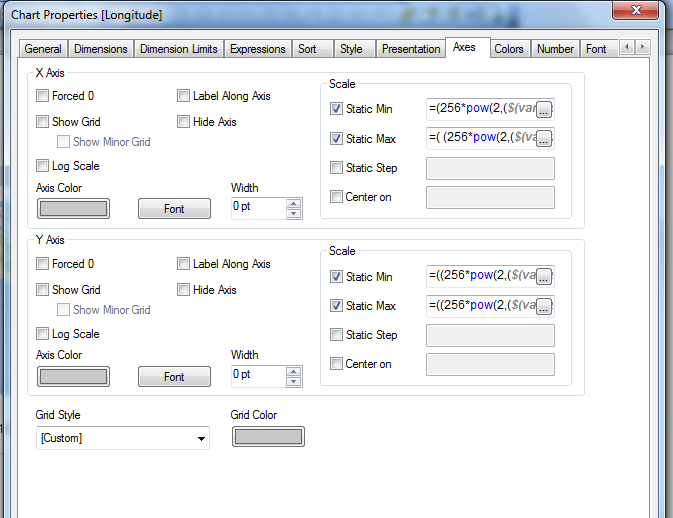
if u will not check your graph will come like this ,
Vivek
- Mark as New
- Bookmark
- Subscribe
- Mute
- Subscribe to RSS Feed
- Permalink
- Report Inappropriate Content
Force 0 is unchecked on both axis.
- Mark as New
- Bookmark
- Subscribe
- Mute
- Subscribe to RSS Feed
- Permalink
- Report Inappropriate Content
No luck, yet. Anyone? Help?
- Mark as New
- Bookmark
- Subscribe
- Mute
- Subscribe to RSS Feed
- Permalink
- Report Inappropriate Content
Hi! I had the same issue... my problem was fixed by doing this 2 things:
1. Uncheck Show Legend
2. Check Plot Area Only
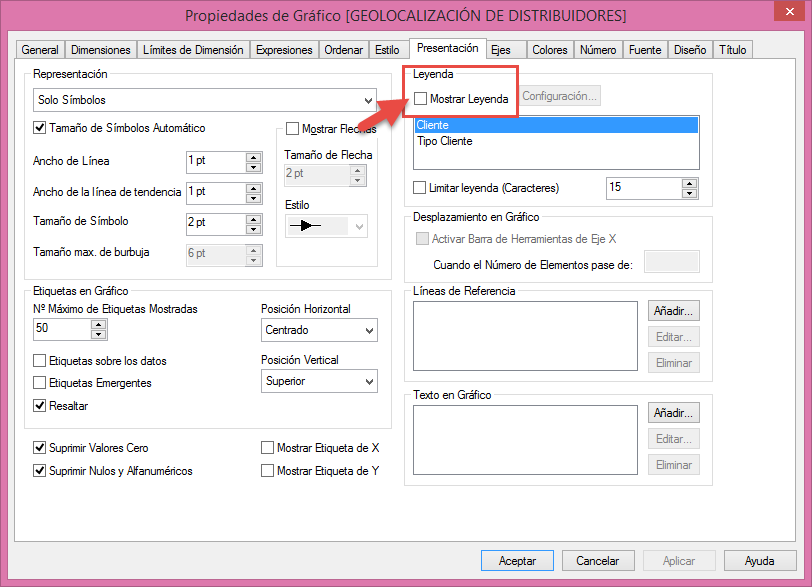
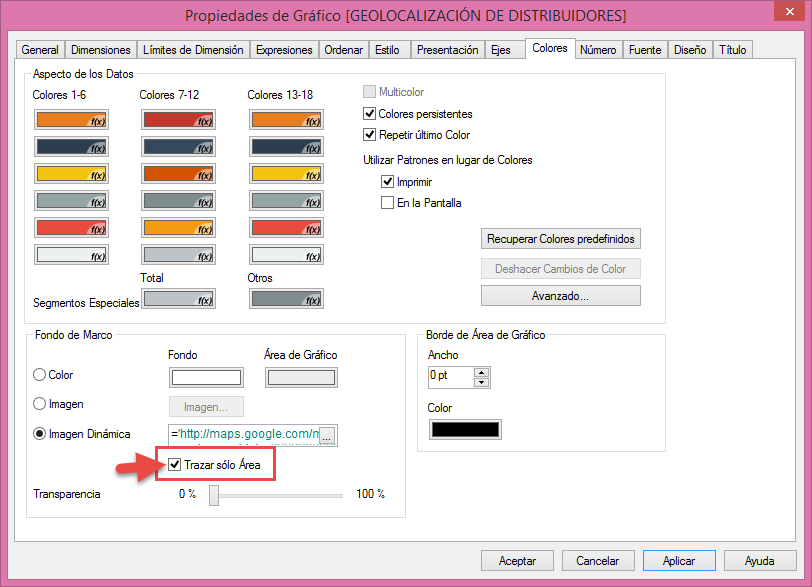
After that, dots are placed correctly.
Regards!
Dai