Unlock a world of possibilities! Login now and discover the exclusive benefits awaiting you.
- Qlik Community
- :
- All Forums
- :
- QlikView App Dev
- :
- Google map Implementation problem
- Subscribe to RSS Feed
- Mark Topic as New
- Mark Topic as Read
- Float this Topic for Current User
- Bookmark
- Subscribe
- Mute
- Printer Friendly Page
- Mark as New
- Bookmark
- Subscribe
- Mute
- Subscribe to RSS Feed
- Permalink
- Report Inappropriate Content
Google map Implementation problem
Hi Everyone,
Here I have implemented Google map but my problem is that the longitude and latitude value according to dimension become change in map. Whenever rather than map it is showing right value.
see in image ,similarly every bubble showing different value in comparison to original longitude and latitude.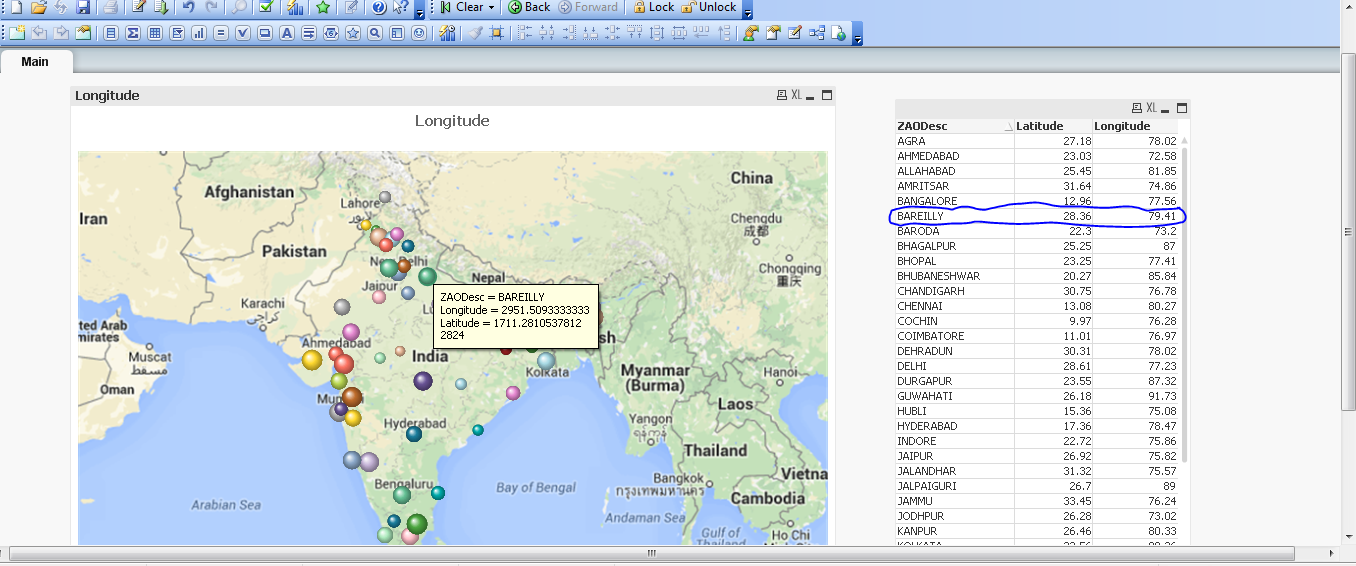
I attached qvw file , I'm not getting why its happening . Please anyone give me some idea how we can solve this issue.
Thanks
- Mark as New
- Bookmark
- Subscribe
- Mute
- Subscribe to RSS Feed
- Permalink
- Report Inappropriate Content
Hi Dhiraj,
there is no data on your attached file.
can you please resend
- Mark as New
- Bookmark
- Subscribe
- Mute
- Subscribe to RSS Feed
- Permalink
- Report Inappropriate Content
Hi Jonathan ,
Thanks for the reply sorry by mistake I uploaded other file now I have attached correct file in same thread you can see..
- Mark as New
- Bookmark
- Subscribe
- Mute
- Subscribe to RSS Feed
- Permalink
- Report Inappropriate Content
Hi Dhiraj,
here's a bit of reading:
If you noticed, the values of fields Latitude and Longitude are used in the chart expressions with same labels, Latitude and Longitude(where the confusion is).
On the Chart, what we see as values for the Latitude and Longitude are the bubble locations(Chart Plots/coordinates) derived by the expressions from fields Latitude and Longitude. This is necessary to plot the bubbles in the chart similar to when you look at an actual Map(Dynamic image)