Unlock a world of possibilities! Login now and discover the exclusive benefits awaiting you.
- Qlik Community
- :
- All Forums
- :
- QlikView App Dev
- :
- Graph Colors Change with Data (based on expressio...
- Subscribe to RSS Feed
- Mark Topic as New
- Mark Topic as Read
- Float this Topic for Current User
- Bookmark
- Subscribe
- Mute
- Printer Friendly Page
- Mark as New
- Bookmark
- Subscribe
- Mute
- Subscribe to RSS Feed
- Permalink
- Report Inappropriate Content
Graph Colors Change with Data (based on expression)
I'm trying to get graph to display Bar colors based on data Values. So far it only takes value of first data set . For example if Group(X Axes) is below 50 then all bars turn same color as the first bar (Red). How can I get Bars to change to color according to Data based on Group(X Axes).
Example: Group1 >50 Then Green , Group2 < 50 Then Red, etc...
This is the formula I'm trying
= if(avg([ Group %Tile]) >= 50 ,RGB(0,145,72), RGB(237,28,46))
RGB are custom colors for report
Accepted Solutions
- Mark as New
- Bookmark
- Subscribe
- Mute
- Subscribe to RSS Feed
- Permalink
- Report Inappropriate Content
- Mark as New
- Bookmark
- Subscribe
- Mute
- Subscribe to RSS Feed
- Permalink
- Report Inappropriate Content
Hi!
Try putting the formula in place as shown below:
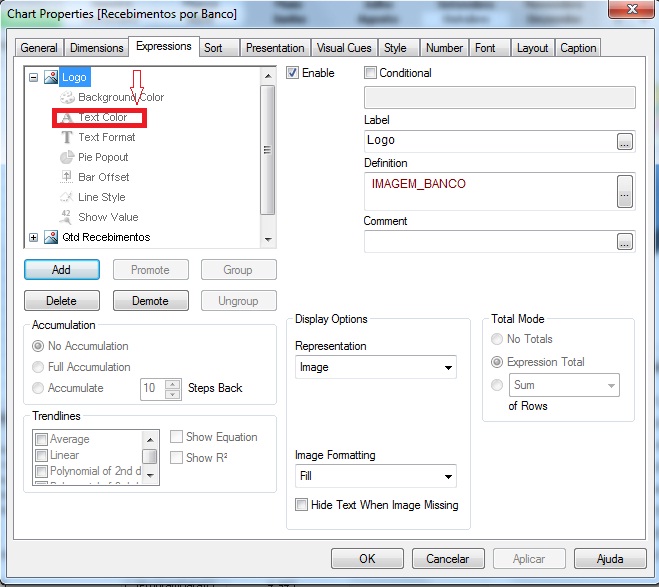
Att.
Rebeca
- Mark as New
- Bookmark
- Subscribe
- Mute
- Subscribe to RSS Feed
- Permalink
- Report Inappropriate Content
Rebecca,
Thank you . It works adding it to the Background Color .
Thank you....
ZD
- Mark as New
- Bookmark
- Subscribe
- Mute
- Subscribe to RSS Feed
- Permalink
- Report Inappropriate Content
Rebecca,
Thank you . It works adding it to the Background Color .
Thank you....
ZD
- Mark as New
- Bookmark
- Subscribe
- Mute
- Subscribe to RSS Feed
- Permalink
- Report Inappropriate Content
This was the answer. Thank you.....
ZD
- Mark as New
- Bookmark
- Subscribe
- Mute
- Subscribe to RSS Feed
- Permalink
- Report Inappropriate Content
Thank you so much!