Unlock a world of possibilities! Login now and discover the exclusive benefits awaiting you.
- Qlik Community
- :
- All Forums
- :
- QlikView App Dev
- :
- Graph based on increase and decrease
- Subscribe to RSS Feed
- Mark Topic as New
- Mark Topic as Read
- Float this Topic for Current User
- Bookmark
- Subscribe
- Mute
- Printer Friendly Page
- Mark as New
- Bookmark
- Subscribe
- Mute
- Subscribe to RSS Feed
- Permalink
- Report Inappropriate Content
Graph based on increase and decrease
Hi All,
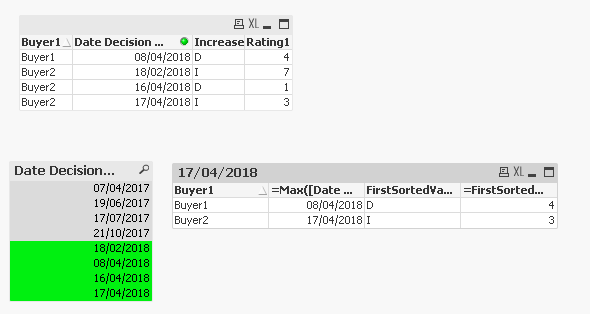
| Buyer1 | Date Decision Made | Increase | Rating |
| Buyer1 | 07/04/2017 | 6 | |
| Buyer1 | 08/04/2018 | D | 4 |
| Buyer2 | 19/06/2017 | 2 | |
| Buyer2 | 18/02/2018 | I | 7 |
| Buyer2 | 16/04/2018 | D | 1 |
| Buyer2 | 17/04/2018 | I | 3 |
| Buyer3 | 17/07/2017 | 5 | |
| Buyer3 | 21/10/2017 | D | 2 |
Above given is the sample data used in my projects. I want to create a graph based on the Increase or decrease of Rating.
If I am applying the filter of Date Decision Made>= 01/01/2018, the I want to get the two rows highlighted in yellow. i.e the max date decision made for the change for my pie chart. I want to do this in UT. The date selection can vary.
Attached the QVW with this raw data.
Let me know if any points needs more clarity
Thanks,
Sijo
Accepted Solutions
- Mark as New
- Bookmark
- Subscribe
- Mute
- Subscribe to RSS Feed
- Permalink
- Report Inappropriate Content
May be with two expressions and no dimension
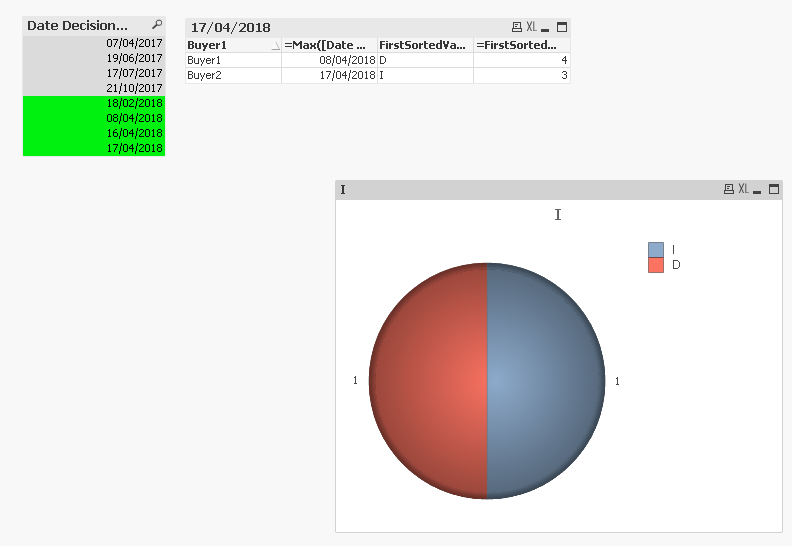
Expression for I
=Sum(Aggr(If(FirstSortedValue(Increase, -[Date Decision Made1]) = 'I', 1), Buyer1))
Expression for D
=Sum(Aggr(If(FirstSortedValue(Increase, -[Date Decision Made1]) = 'D', 1), Buyer1))
- Mark as New
- Bookmark
- Subscribe
- Mute
- Subscribe to RSS Feed
- Permalink
- Report Inappropriate Content
What is the logic behind only seeing the two yellow rows? Buyer 2 had increase and decrease in 2018, why are they not part of the required output
- Mark as New
- Bookmark
- Subscribe
- Mute
- Subscribe to RSS Feed
- Permalink
- Report Inappropriate Content
Hi Sunny,
For Buyer2 there are multiple changes happened from 01/01/2018. The filter applied is Date Decision Made >= "01/01/2018". The requirement is to take the latest position , i.e max of Date Decision Made (17/04/2018). Hence the row required will be the one highlighted in yellow.
Thanks,
Sijo
- Mark as New
- Bookmark
- Subscribe
- Mute
- Subscribe to RSS Feed
- Permalink
- Report Inappropriate Content
Like this?
- Mark as New
- Bookmark
- Subscribe
- Mute
- Subscribe to RSS Feed
- Permalink
- Report Inappropriate Content
Thanks for that.
The problem is I don't have buyer in my dimension. The requirement want to create a pie chart with "1" value as Increase and "1" value as Decrease.
Thanks.
- Mark as New
- Bookmark
- Subscribe
- Mute
- Subscribe to RSS Feed
- Permalink
- Report Inappropriate Content
May be with two expressions and no dimension
Expression for I
=Sum(Aggr(If(FirstSortedValue(Increase, -[Date Decision Made1]) = 'I', 1), Buyer1))
Expression for D
=Sum(Aggr(If(FirstSortedValue(Increase, -[Date Decision Made1]) = 'D', 1), Buyer1))
- Mark as New
- Bookmark
- Subscribe
- Mute
- Subscribe to RSS Feed
- Permalink
- Report Inappropriate Content
Thanks Let me try this
- Mark as New
- Bookmark
- Subscribe
- Mute
- Subscribe to RSS Feed
- Permalink
- Report Inappropriate Content
Sounds good 
- Mark as New
- Bookmark
- Subscribe
- Mute
- Subscribe to RSS Feed
- Permalink
- Report Inappropriate Content
thanks finally it worked. Done slight changes also to suits the exact requirement.