Unlock a world of possibilities! Login now and discover the exclusive benefits awaiting you.
Announcements
April 13–15 - Dare to Unleash a New Professional You at Qlik Connect 2026: Register Now!
- Qlik Community
- :
- All Forums
- :
- QlikView App Dev
- :
- Graph progression
Options
- Subscribe to RSS Feed
- Mark Topic as New
- Mark Topic as Read
- Float this Topic for Current User
- Bookmark
- Subscribe
- Mute
- Printer Friendly Page
Turn on suggestions
Auto-suggest helps you quickly narrow down your search results by suggesting possible matches as you type.
Showing results for
Not applicable
2017-03-13
05:56 PM
- Mark as New
- Bookmark
- Subscribe
- Mute
- Subscribe to RSS Feed
- Permalink
- Report Inappropriate Content
Graph progression
Hello,
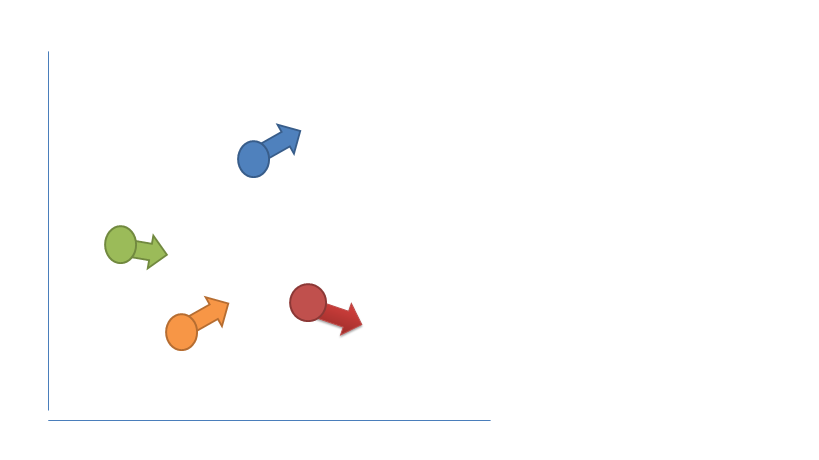
I saw a graph progression during a Qlik presentation and I don't know how can i do.
I put an image, someone can help me with an exemple please.
I want to represent the progression between 2 period.
The point represent the current date, et the arrow if the progression is up or down.
Best Regards
Hamza
699 Views
1 Solution
Accepted Solutions
Specialist
2017-03-13
07:40 PM
- Mark as New
- Bookmark
- Subscribe
- Mute
- Subscribe to RSS Feed
- Permalink
- Report Inappropriate Content
Hi Hamza,
You can do something similar with a scatter chart with 2 dimensions and 2 expresions:
- First dimension is e.g the technology (Qlik, Tableau, Microsoft)
- Second dimension is the year
- First expression is the X Axis.
- Second expression is the Y Axis
Regards,
H
572 Views
2 Replies
Specialist
2017-03-13
07:40 PM
- Mark as New
- Bookmark
- Subscribe
- Mute
- Subscribe to RSS Feed
- Permalink
- Report Inappropriate Content
Hi Hamza,
You can do something similar with a scatter chart with 2 dimensions and 2 expresions:
- First dimension is e.g the technology (Qlik, Tableau, Microsoft)
- Second dimension is the year
- First expression is the X Axis.
- Second expression is the Y Axis
Regards,
H
573 Views
Not applicable
2017-03-23
05:03 PM
Author
- Mark as New
- Bookmark
- Subscribe
- Mute
- Subscribe to RSS Feed
- Permalink
- Report Inappropriate Content
Thank you very much Munoz Hector.