Unlock a world of possibilities! Login now and discover the exclusive benefits awaiting you.
Announcements
April 13–15 - Dare to Unleash a New Professional You at Qlik Connect 2026: Register Now!
- Qlik Community
- :
- All Forums
- :
- QlikView App Dev
- :
- Graph
Options
- Subscribe to RSS Feed
- Mark Topic as New
- Mark Topic as Read
- Float this Topic for Current User
- Bookmark
- Subscribe
- Mute
- Printer Friendly Page
Turn on suggestions
Auto-suggest helps you quickly narrow down your search results by suggesting possible matches as you type.
Showing results for
Creator
2018-01-26
10:28 AM
- Mark as New
- Bookmark
- Subscribe
- Mute
- Subscribe to RSS Feed
- Permalink
- Report Inappropriate Content
Graph
Hi Guys,
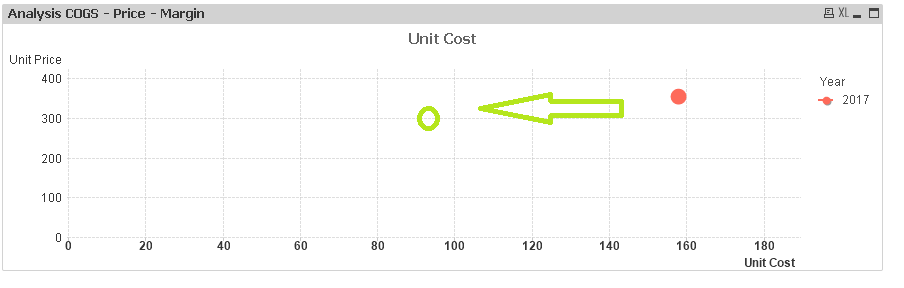
I build this graph below.
I would like to have another circle on the graph that identify the Product (Unit Price and Cost position) of the previous year.
I know how to do it.
Question is: for a better usability of graph, there's possibility to create a line between the 2 circle on the graph? (Like an arrow , a line ..or something?
Thanks!
367 Views
0 Replies