Unlock a world of possibilities! Login now and discover the exclusive benefits awaiting you.
- Qlik Community
- :
- All Forums
- :
- QlikView App Dev
- :
- Grid chart aggregation error
- Subscribe to RSS Feed
- Mark Topic as New
- Mark Topic as Read
- Float this Topic for Current User
- Bookmark
- Subscribe
- Mute
- Printer Friendly Page
- Mark as New
- Bookmark
- Subscribe
- Mute
- Subscribe to RSS Feed
- Permalink
- Report Inappropriate Content
Grid chart aggregation error
Hi guys,
Please help me to fix my expression for first dimension.
I have expression with aggregation function, which gives me empty result.
Please find my attached file.
Thanks,
- Tags:
- new_to_qlikview
- Mark as New
- Bookmark
- Subscribe
- Mute
- Subscribe to RSS Feed
- Permalink
- Report Inappropriate Content
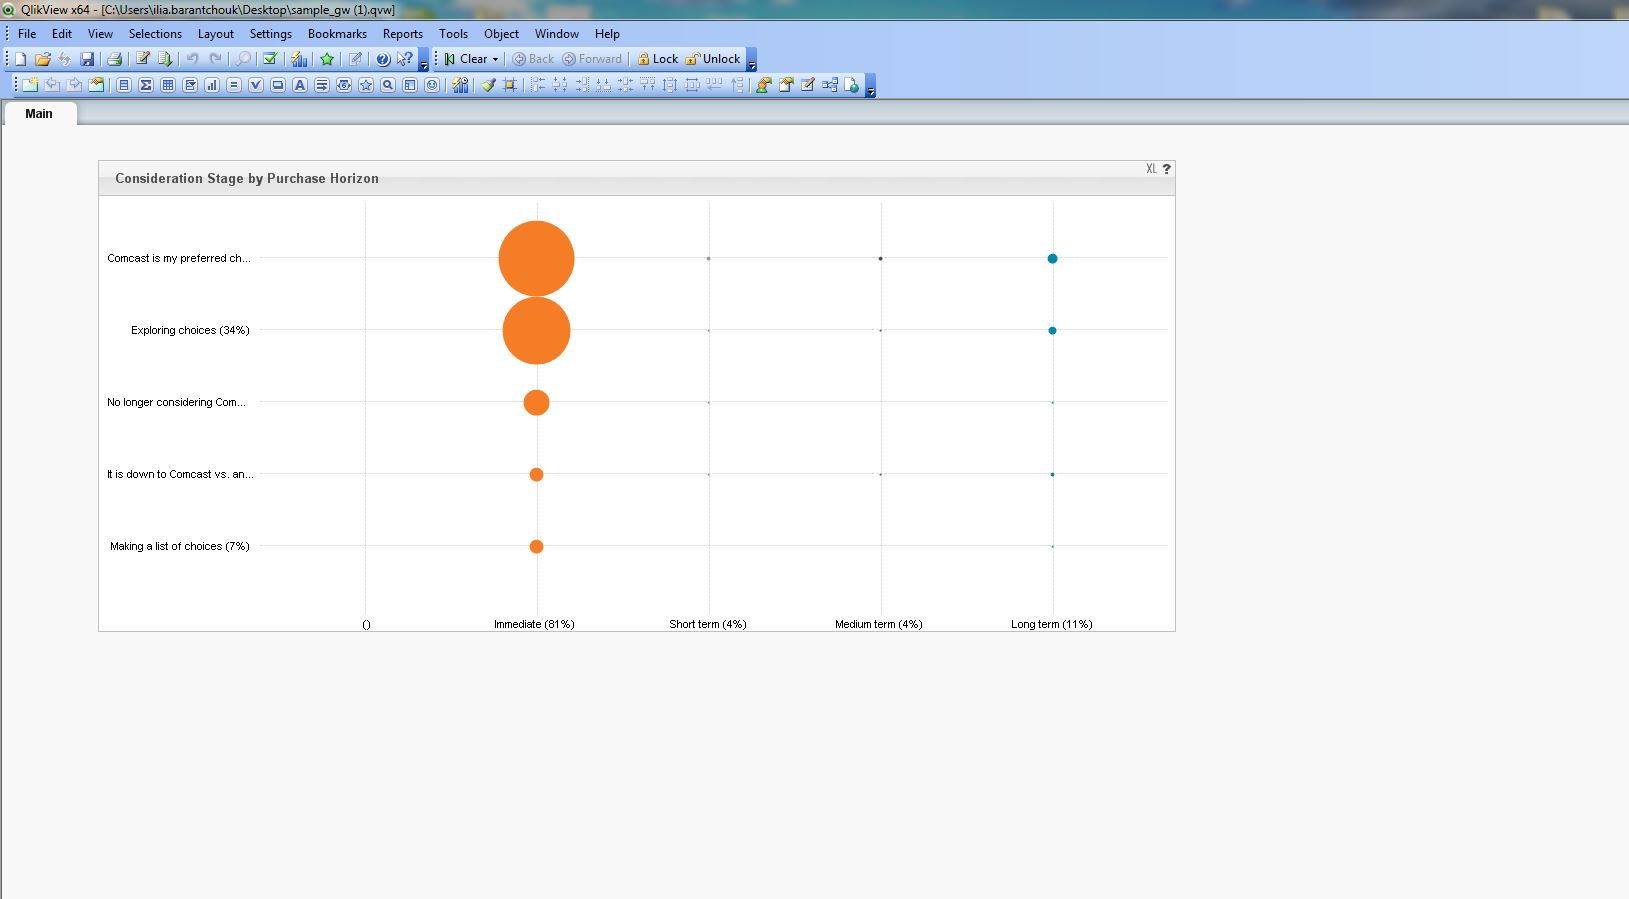
Vladimir - I have attached my app. Your calculation is working properly. You are unable to see the .01% element value associated with the third dimension item because the Y scale in comparison to the other plotted points (e.g. Orange, in this case) are so much larger.
Consider changing the Y Scale (Primary Axis numbers) manually in the Axes tab in Chart properties.
Greg
- Mark as New
- Bookmark
- Subscribe
- Mute
- Subscribe to RSS Feed
- Permalink
- Report Inappropriate Content
Hi Greg,
But when I hide aggr expression from first dimension, the chart shows only 4 tags.
Please see my file.
Thanks, !
- Mark as New
- Bookmark
- Subscribe
- Mute
- Subscribe to RSS Feed
- Permalink
- Report Inappropriate Content
No ideas why or how???
- Mark as New
- Bookmark
- Subscribe
- Mute
- Subscribe to RSS Feed
- Permalink
- Report Inappropriate Content
I am using QlikView 11.20 SR6.
- Mark as New
- Bookmark
- Subscribe
- Mute
- Subscribe to RSS Feed
- Permalink
- Report Inappropriate Content
I'm using the same. I see 0.01, but when I remove aggr after Purchase horizon, it shows only 4 tags.
- Mark as New
- Bookmark
- Subscribe
- Mute
- Subscribe to RSS Feed
- Permalink
- Report Inappropriate Content
And your expression is the same as my expression - I moved the AGGR (slightly) - in my app.
- Mark as New
- Bookmark
- Subscribe
- Mute
- Subscribe to RSS Feed
- Permalink
- Report Inappropriate Content
Image from your app. still 5 tags
- Mark as New
- Bookmark
- Subscribe
- Mute
- Subscribe to RSS Feed
- Permalink
- Report Inappropriate Content
Other than:
1 - Turning on/off Suppression on both dimensions (almost like a reset/refresh),
2 - Rebuilding Chart from scratch to see if problem exists
3 - Removing zero value suppression in chart properties
4 - Increasing the width of your chart
5 - Formatting the numbers to fixed to 1-2 decimal spots
6 - Resizing the points in the Presentation tab
...not sure what else to try.
- Mark as New
- Bookmark
- Subscribe
- Mute
- Subscribe to RSS Feed
- Permalink
- Report Inappropriate Content
I found why it shows, because Purchase Horizon has 1 missing:
Other words Total respondents for Purchase Horizon 9117,
Total respondents for Consideration Stage 9118.
How can I remove tag, if one of them not answering?