Unlock a world of possibilities! Login now and discover the exclusive benefits awaiting you.
- Qlik Community
- :
- All Forums
- :
- QlikView App Dev
- :
- Grid chart (bubble graph)
- Subscribe to RSS Feed
- Mark Topic as New
- Mark Topic as Read
- Float this Topic for Current User
- Bookmark
- Subscribe
- Mute
- Printer Friendly Page
- Mark as New
- Bookmark
- Subscribe
- Mute
- Subscribe to RSS Feed
- Permalink
- Report Inappropriate Content
Grid chart (bubble graph)
Hi,
I want a Grid chart with three expressions; Number of breakdowns, hours of maintenance on breakdown and total costs of the breakdown .
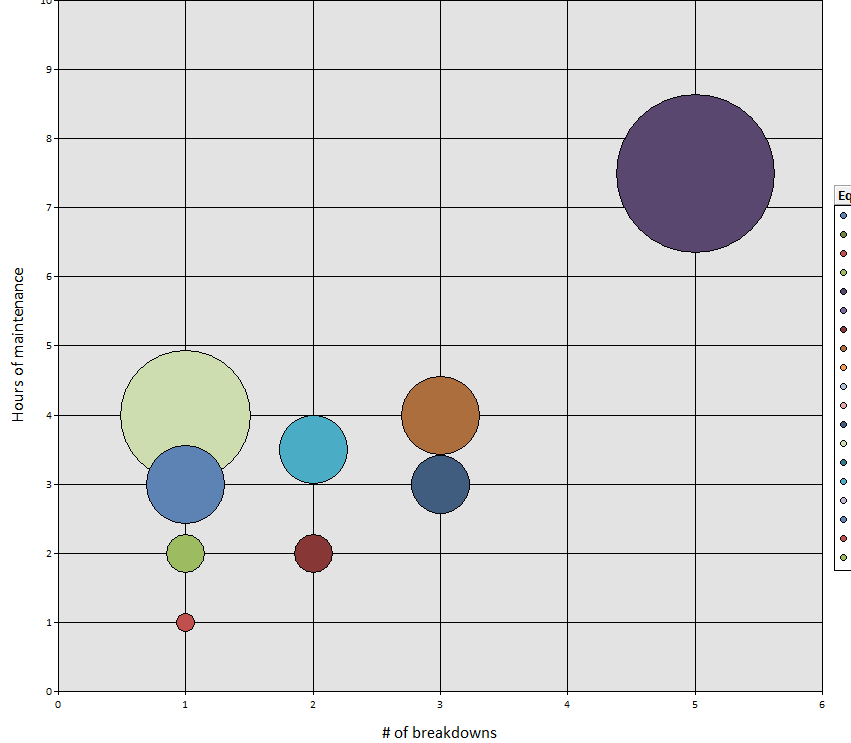
How do i get this? i tried alot of things but it keeps says error in calculation. (the photo is made in access)
Thanks in advance.
Accepted Solutions
- Mark as New
- Bookmark
- Subscribe
- Mute
- Subscribe to RSS Feed
- Permalink
- Report Inappropriate Content
Use a scatter chart and add one dimension and your three expressions.
talk is cheap, supply exceeds demand
- Mark as New
- Bookmark
- Subscribe
- Mute
- Subscribe to RSS Feed
- Permalink
- Report Inappropriate Content
Use a scatter chart and add one dimension and your three expressions.
talk is cheap, supply exceeds demand
- Mark as New
- Bookmark
- Subscribe
- Mute
- Subscribe to RSS Feed
- Permalink
- Report Inappropriate Content
Ok, now i got 75% of it working.
But the number of breakdowns comes from the selected maintenance type.
Now it shows all maintenance type (=Count(Maintenance_type)) but it should only count maintenancetype Breakdown.
- Mark as New
- Bookmark
- Subscribe
- Mute
- Subscribe to RSS Feed
- Permalink
- Report Inappropriate Content
Try changing that expression to =Count({<Maintenance_type={'Breakdown'}>}Maintenance_type)
talk is cheap, supply exceeds demand
- Mark as New
- Bookmark
- Subscribe
- Mute
- Subscribe to RSS Feed
- Permalink
- Report Inappropriate Content
Did it but all the parts that had 0 breakdowns are still in it.