Unlock a world of possibilities! Login now and discover the exclusive benefits awaiting you.
- Qlik Community
- :
- All Forums
- :
- QlikView App Dev
- :
- Group by and Count functions
- Subscribe to RSS Feed
- Mark Topic as New
- Mark Topic as Read
- Float this Topic for Current User
- Bookmark
- Subscribe
- Mute
- Printer Friendly Page
- Mark as New
- Bookmark
- Subscribe
- Mute
- Subscribe to RSS Feed
- Permalink
- Report Inappropriate Content
Group by and Count functions
Well, that's the situation:
I have five columns - code, goal, month, year and percent - organized that way, for example:
Code Goal month year percent
1 Develop new solution 2 2016 85%
1 Introduce business model 10 2016 40%
The columns 'Month' and 'Year' refer to the delivery deadline. The 'Percent' column refer to the evolution of goal.
It is possible to compare 'Year' and 'Month' to the current date, perform a counting function and set up a chart that tell me what goals are delayed and which goals are OK?
(I want to do this in a chart expression).
I am very grateful for the help.
Accepted Solutions
- Mark as New
- Bookmark
- Subscribe
- Mute
- Subscribe to RSS Feed
- Permalink
- Report Inappropriate Content
May be like this?
Script:
Table:
LOAD Code,
Goal,
Month(Date) as Month,
Year(Date) as Year,
MonthName(Date) as MonthYear,
Date,
percent as Percent;
LOAD *,
Date(MonthStart(Date#(Num(month&year, '000000'), 'MMYYYY')), 'MMM-YYYY') as Date;
LOAD * Inline [
Code, Goal, month, year, percent
1, Develop new solution, 2, 2016, 85%
1, Introduce business model, 10, 2016, 40%
];
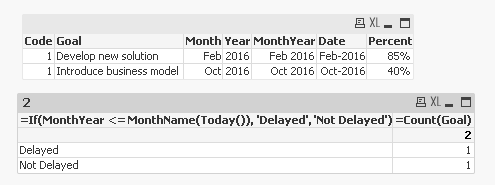
Dimensions:
=If(MonthYear <= MonthName(Today()), 'Delayed', 'Not Delayed')
Expression:
Count(Goal)
- Mark as New
- Bookmark
- Subscribe
- Mute
- Subscribe to RSS Feed
- Permalink
- Report Inappropriate Content
Not sure I fully understand the requirement. Would you be able to draw out what you are looking for in your chart?
- Mark as New
- Bookmark
- Subscribe
- Mute
- Subscribe to RSS Feed
- Permalink
- Report Inappropriate Content
Yes, that's my doubt. I Would like to create a chart with two divisions : Late goals and goals that are not delayed, comparing its deadline date to the current date. It's possible to create an expression in the chart to do this?
- Mark as New
- Bookmark
- Subscribe
- Mute
- Subscribe to RSS Feed
- Permalink
- Report Inappropriate Content
Based on the data provided, which goal is not delayed which one is?
- Mark as New
- Bookmark
- Subscribe
- Mute
- Subscribe to RSS Feed
- Permalink
- Report Inappropriate Content
Based on the data provided, the goal 'Develop New Solution' is delayed because it deadline date is February / 2016, and the goal 'Introduce Business Model' is not delayed because it deadline date is October / 2016.
The expression must use the current date as parameter. If a goal is scheduled for March and we are in April, this project / goal is delayed...
- Mark as New
- Bookmark
- Subscribe
- Mute
- Subscribe to RSS Feed
- Permalink
- Report Inappropriate Content
May be like this?
Script:
Table:
LOAD Code,
Goal,
Month(Date) as Month,
Year(Date) as Year,
MonthName(Date) as MonthYear,
Date,
percent as Percent;
LOAD *,
Date(MonthStart(Date#(Num(month&year, '000000'), 'MMYYYY')), 'MMM-YYYY') as Date;
LOAD * Inline [
Code, Goal, month, year, percent
1, Develop new solution, 2, 2016, 85%
1, Introduce business model, 10, 2016, 40%
];
Dimensions:
=If(MonthYear <= MonthName(Today()), 'Delayed', 'Not Delayed')
Expression:
Count(Goal)
- Mark as New
- Bookmark
- Subscribe
- Mute
- Subscribe to RSS Feed
- Permalink
- Report Inappropriate Content
Thank you very much!