Unlock a world of possibilities! Login now and discover the exclusive benefits awaiting you.
- Qlik Community
- :
- All Forums
- :
- QlikView App Dev
- :
- Grouping of columns under header1, header 2 etc
- Subscribe to RSS Feed
- Mark Topic as New
- Mark Topic as Read
- Float this Topic for Current User
- Bookmark
- Subscribe
- Mute
- Printer Friendly Page
- Mark as New
- Bookmark
- Subscribe
- Mute
- Subscribe to RSS Feed
- Permalink
- Report Inappropriate Content
Grouping of columns under header1, header 2 etc
Hi,
I have one straight table with 20-30 columns with different expressions for each column. I want to gourp these columns under different headings. I understand that pivot table is the correct approach for that but additional to whatever i have written in expressions for each column what all things needs to be defined and where in pivot table properties. Kindly give detailed explanation.
Ex:
Header 1 Header2
Exp1 Exp2 Exp 3 Exp4 Exp5
- Mark as New
- Bookmark
- Subscribe
- Mute
- Subscribe to RSS Feed
- Permalink
- Report Inappropriate Content
Hi,
This is not possible in Qlikview.
You can use text boxes but it's not a good solution as the pivot table can be collapsed and expanded.
JV
- Mark as New
- Bookmark
- Subscribe
- Mute
- Subscribe to RSS Feed
- Permalink
- Report Inappropriate Content
This not possible...Insted you have this Header 1 and 2 in Dimension and drag it to the top in Pivot Table..
Eg: Dimension 1 Dimension 2 Exp 1 Exp 2
Country 1 Branch 1
Country 2 Branch 2
Now you drag dimension to the top of Expression...(Cross Table)
Dimension 2 Dimension 1 Country 1 Country 2
Branch 1 Exp 1 Exp 2 Exp 1 Exp 2
Branch 2
But not different expression grouping..
Thanks,
Selva
- Mark as New
- Bookmark
- Subscribe
- Mute
- Subscribe to RSS Feed
- Permalink
- Report Inappropriate Content
A tricky workaround is putting textbox right above your headers and using proper fomatting you can have a very nice layout
- Mark as New
- Bookmark
- Subscribe
- Mute
- Subscribe to RSS Feed
- Permalink
- Report Inappropriate Content
Thanks. Yes at the moment i have used text box but the issue is when i export to excel at that time these headings do not come as those are not part of the table chart
- Mark as New
- Bookmark
- Subscribe
- Mute
- Subscribe to RSS Feed
- Permalink
- Report Inappropriate Content
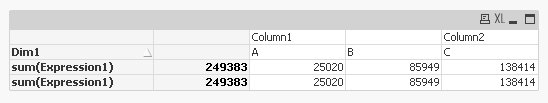
If transposing your straight table to "Horizontal" is an option, another trick is to drag one expression right above the header.
In this case when sending to excel, QlikView will 'unrotate' the table. You should write a macro to export it right
PFA
- Mark as New
- Bookmark
- Subscribe
- Mute
- Subscribe to RSS Feed
- Permalink
- Report Inappropriate Content
by using macro i can get all objects present on the sheet but the limitation is it doest not work in AJAX environment
- Mark as New
- Bookmark
- Subscribe
- Mute
- Subscribe to RSS Feed
- Permalink
- Report Inappropriate Content
It´s always a pros x cons balance 
- Mark as New
- Bookmark
- Subscribe
- Mute
- Subscribe to RSS Feed
- Permalink
- Report Inappropriate Content
Hi,
I have added text boxes but for some selections in my table it has more columns and hence size of the table changes and text boxes appear in wrong places coz of that. What is the workaround. how can i restrict the size of the table
- Mark as New
- Bookmark
- Subscribe
- Mute
- Subscribe to RSS Feed
- Permalink
- Report Inappropriate Content
I don´t see how do this.