Unlock a world of possibilities! Login now and discover the exclusive benefits awaiting you.
- Qlik Community
- :
- All Forums
- :
- QlikView App Dev
- :
- Grouping of expression in straight or pivot chart
Options
- Subscribe to RSS Feed
- Mark Topic as New
- Mark Topic as Read
- Float this Topic for Current User
- Bookmark
- Subscribe
- Mute
- Printer Friendly Page
Turn on suggestions
Auto-suggest helps you quickly narrow down your search results by suggesting possible matches as you type.
Showing results for
Not applicable
2015-03-11
03:27 AM
- Mark as New
- Bookmark
- Subscribe
- Mute
- Subscribe to RSS Feed
- Permalink
- Report Inappropriate Content
Grouping of expression in straight or pivot chart
Hi,
I need to show the data like this in the chart. The right side theree fields are three different expressions , I want group them under sales. So how can I do this? Please help me on this.
Sales | Sum of sales |
Count of Employees | |
Division wise sales |
- Tags:
- new_to_qlikview
444 Views
2 Replies
Partner - Champion III
2015-03-11
05:04 AM
- Mark as New
- Bookmark
- Subscribe
- Mute
- Subscribe to RSS Feed
- Permalink
- Report Inappropriate Content
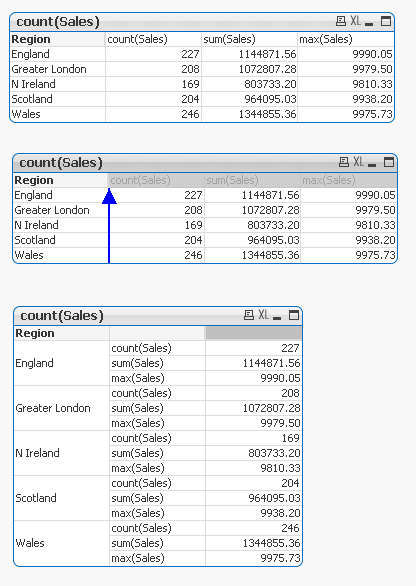
Use a pivot table object and drag an expression column to the left until you see a fat vertical blue arrow. Then let go of the mouse and the expression should be placed as rows in the pivot table.
talk is cheap, supply exceeds demand
Not applicable
2015-03-11
05:12 AM
Author
- Mark as New
- Bookmark
- Subscribe
- Mute
- Subscribe to RSS Feed
- Permalink
- Report Inappropriate Content
HI Sowmay,
By using Pivot Table you can do grouping.
362 Views