Unlock a world of possibilities! Login now and discover the exclusive benefits awaiting you.
- Qlik Community
- :
- All Forums
- :
- QlikView App Dev
- :
- Grouping of values in a barchart
- Subscribe to RSS Feed
- Mark Topic as New
- Mark Topic as Read
- Float this Topic for Current User
- Bookmark
- Subscribe
- Mute
- Printer Friendly Page
- Mark as New
- Bookmark
- Subscribe
- Mute
- Subscribe to RSS Feed
- Permalink
- Report Inappropriate Content
Grouping of values in a barchart
Hi QC
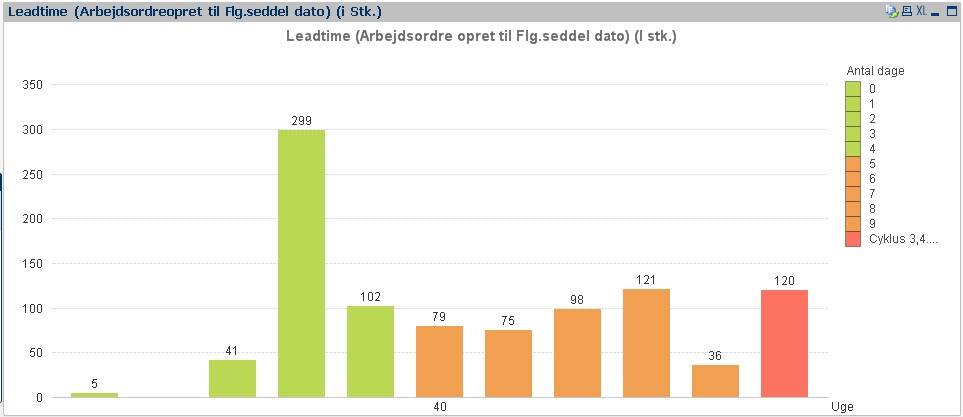
I have a problem i havent been able to solve... the x-axe shows time (in days) and y-axe shows amount.
I wanted to group days 0 - 4 and its values (the green bars below) in one bar, then days 5 - 9 in one bar (the orange bars) and so forth...
Ive done this in excel on the same data by grouping the days 0 - 4 in a pivot table and make the chart based on the data from the pivot table, but i havent been able to pull it off in Qlikview.
Days are entered as a dimension and amount as an expression, and the chart is made in the QV IE Plugin.
Anybody have a solution on how to do this?
Accepted Solutions
- Mark as New
- Bookmark
- Subscribe
- Mute
- Subscribe to RSS Feed
- Permalink
- Report Inappropriate Content
I do aging by:
1. setting up buckets using inline script statements that have from and to amounts
Buckets:
LOAD * INLINE [
Bucket, Start, End
>7 days remain, -999, -7
Due this week, -6, 0
<1 month over, 1, 30
<2 months over, 31, 60
❤️ months over, 61, 90
>3 months over, 91, 9999
];
2. running the transaction details through an interval match against this buckets table
INTERVALMATCH (DueDays)
LOAD
Start,
End
RESIDENT Buckets;
3. using the bucket as a dimension on the chart
Jonathan
- Mark as New
- Bookmark
- Subscribe
- Mute
- Subscribe to RSS Feed
- Permalink
- Report Inappropriate Content
Try looking at the class() function in the Help File, it allows you to place your values in buckets (0-4,5-10,-11-15 etc).
Hope that helps,
Matt - Visual Analytics Ltd
@QlikviewBI
Qlikview Design Blog: http://QVDesign.wordpress.com
- Mark as New
- Bookmark
- Subscribe
- Mute
- Subscribe to RSS Feed
- Permalink
- Report Inappropriate Content
ive tried to toy around with the class function without getting it to work fully, as i wanted it to...
My time/days is calculated through this dimension: =(NetWorkDays(BDW_ABS_ORDER_Date, ABS_PACKINGNOTE.DELIVERYDATE, $(=SH_Dage)))
and my amount is: Sum(DELEVERY_SCAN.QUANTITY)
ive tried this:
=class(NetWorkDays(BDW_ABS_ORDER_Date, ABS_PACKINGNOTE.DELIVERYDATE, $(=SH_Dage)),4)
but that shows it like this:
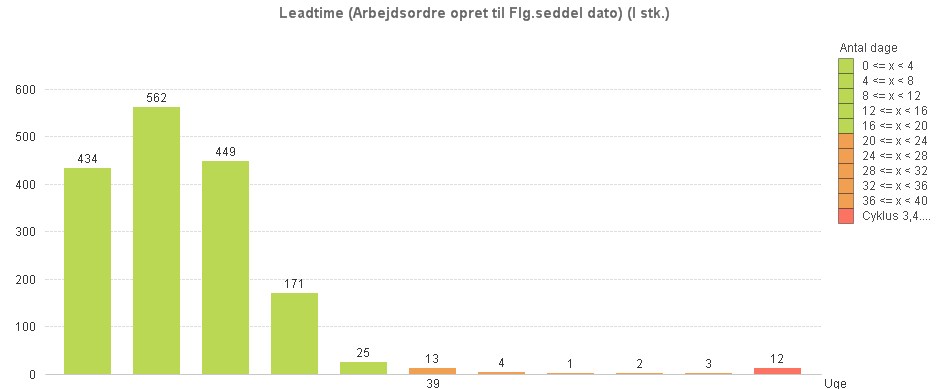
it groups by 4 every time... and i wanted to define the value of the group so i can do: 0 - 4, 5 - 9, 10 - 20 etc. i havent managed to figure out how to put that into the formula above, any ideas?
- Mark as New
- Bookmark
- Subscribe
- Mute
- Subscribe to RSS Feed
- Permalink
- Report Inappropriate Content
Bump... anybody with an idea how to do the =class function with specific intervals?
- Mark as New
- Bookmark
- Subscribe
- Mute
- Subscribe to RSS Feed
- Permalink
- Report Inappropriate Content
bump, anyone with an idea how to solve this issue with =class function having specific intervals?
- Mark as New
- Bookmark
- Subscribe
- Mute
- Subscribe to RSS Feed
- Permalink
- Report Inappropriate Content
I do aging by:
1. setting up buckets using inline script statements that have from and to amounts
Buckets:
LOAD * INLINE [
Bucket, Start, End
>7 days remain, -999, -7
Due this week, -6, 0
<1 month over, 1, 30
<2 months over, 31, 60
❤️ months over, 61, 90
>3 months over, 91, 9999
];
2. running the transaction details through an interval match against this buckets table
INTERVALMATCH (DueDays)
LOAD
Start,
End
RESIDENT Buckets;
3. using the bucket as a dimension on the chart
Jonathan
- Mark as New
- Bookmark
- Subscribe
- Mute
- Subscribe to RSS Feed
- Permalink
- Report Inappropriate Content
Thanks buddy... il try solve it like that 
- Mark as New
- Bookmark
- Subscribe
- Mute
- Subscribe to RSS Feed
- Permalink
- Report Inappropriate Content
Great. May be worth you marking post as solved to take out of unsolved list.
Jonathan
- Mark as New
- Bookmark
- Subscribe
- Mute
- Subscribe to RSS Feed
- Permalink
- Report Inappropriate Content
its been done, thanks