Unlock a world of possibilities! Login now and discover the exclusive benefits awaiting you.
- Qlik Community
- :
- All Forums
- :
- QlikView App Dev
- :
- HELP
- Subscribe to RSS Feed
- Mark Topic as New
- Mark Topic as Read
- Float this Topic for Current User
- Bookmark
- Subscribe
- Mute
- Printer Friendly Page
- Mark as New
- Bookmark
- Subscribe
- Mute
- Subscribe to RSS Feed
- Permalink
- Report Inappropriate Content
HELP
Dear Team,
I stuck a requirement Kindly help me .
I Have a Sale data.i want to Caluclate some figure ..
| Header 1 | Header 2 | Header 3 | Header 4 | Header 5 | Header 6 | |||
|---|---|---|---|---|---|---|---|---|
|
|
| ||||||
| SUMMARY | TOTAL | A | B | C | ||||
| MARKET TYP | 20 | 3 | 5 | 12 | ||||
| MARKET SIZE | 1000 | 500 | 300 | 200 |
HERE TOAL IS SHOWING TOTAL PERSON WHO SALED THINGS. AND SUM SALES
A:-SHOWING 50% SALE WITH COUNT OF THOSE PERSON WHO SALED 50% THNGS
B:-SHOWING 30% SALE WITH COUNT OF THOSE PERSON WHO ONLY SALED 30 %
C:-SAME SHOWING ONLY 20%
For this i am sharing data
- « Previous Replies
-
- 1
- 2
- Next Replies »
- Mark as New
- Bookmark
- Subscribe
- Mute
- Subscribe to RSS Feed
- Permalink
- Report Inappropriate Content
Still be waiting
- Mark as New
- Bookmark
- Subscribe
- Mute
- Subscribe to RSS Feed
- Permalink
- Report Inappropriate Content
Still be waiting
- Mark as New
- Bookmark
- Subscribe
- Mute
- Subscribe to RSS Feed
- Permalink
- Report Inappropriate Content
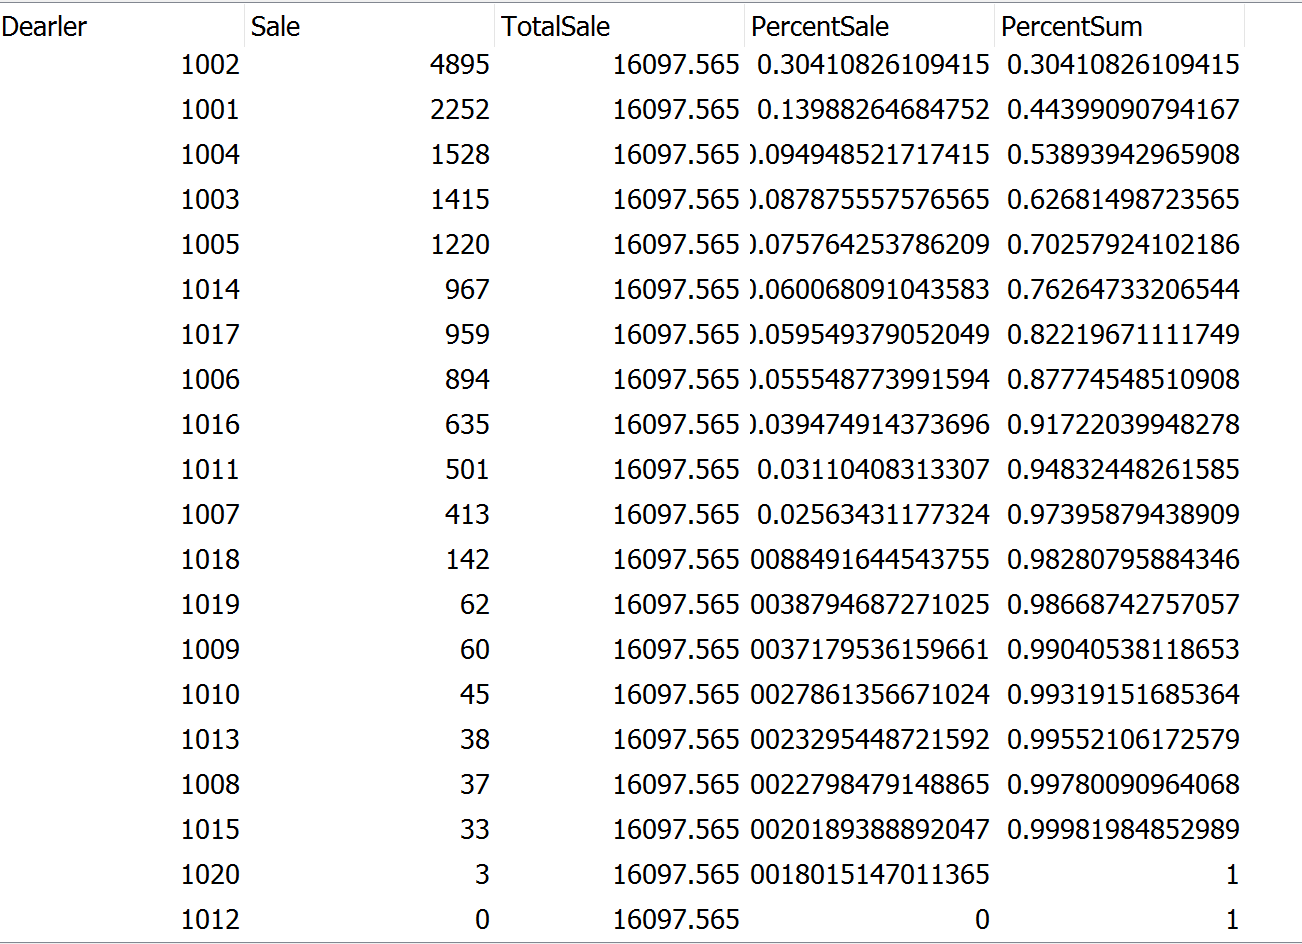
Normally It doesn't work like that. In your data you have 2 top values with 4895 and 2252, both contribute to total 44%.
Now the third top value 1528 if added becomes 53% of total contribution.
Now here I need to know how do you want to move forward, if we include 3rd value in the 50% expression, the total will become more than 50%(its 53%)
The ideal situation of having exact values at 50%, 80% etc generally won't be there in real data.
If you want exact values of 50%, 80%, we can show by direct calculation but how will you distribute the count as they don't exactly falls into the 50%, next 30% and next 20% boundaries. See the data below -
Let me know how do you want, accordingly will make the changes
- Mark as New
- Bookmark
- Subscribe
- Mute
- Subscribe to RSS Feed
- Permalink
- Report Inappropriate Content
See the attached where I calculated Sum as you desired but normally not preferred, also in count I included values which are near to 50%, 80%
- « Previous Replies
-
- 1
- 2
- Next Replies »