Unlock a world of possibilities! Login now and discover the exclusive benefits awaiting you.
- Qlik Community
- :
- All Forums
- :
- QlikView App Dev
- :
- Having 2 graph types on same graph
Options
- Subscribe to RSS Feed
- Mark Topic as New
- Mark Topic as Read
- Float this Topic for Current User
- Bookmark
- Subscribe
- Mute
- Printer Friendly Page
Turn on suggestions
Auto-suggest helps you quickly narrow down your search results by suggesting possible matches as you type.
Showing results for
Not applicable
2014-06-21
10:37 AM
- Mark as New
- Bookmark
- Subscribe
- Mute
- Subscribe to RSS Feed
- Permalink
- Report Inappropriate Content
Having 2 graph types on same graph
how can i have a bar graph and line chart on the same chart. I can do that in excel
I attached a sample on excel
509 Views
3 Replies
Not applicable
2014-06-21
10:46 AM
Author
- Mark as New
- Bookmark
- Subscribe
- Mute
- Subscribe to RSS Feed
- Permalink
- Report Inappropriate Content
You can use combo chart option.
391 Views
Champion III
2014-06-21
10:46 AM
- Mark as New
- Bookmark
- Subscribe
- Mute
- Subscribe to RSS Feed
- Permalink
- Report Inappropriate Content
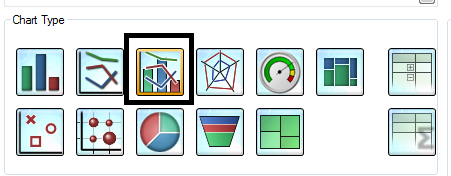
Create a chart with combo chart in the properties >> General >> select Chart type combo chart (which is line and bar chart)
See the attached snap
391 Views
MVP
2014-06-21
11:29 AM
- Mark as New
- Bookmark
- Subscribe
- Mute
- Subscribe to RSS Feed
- Permalink
- Report Inappropriate Content
if you installed Qlikview
goto your qlik installation folder, then in examples, then documents
open Data Visualization.qvw and you can find some examples of combo chart, see image
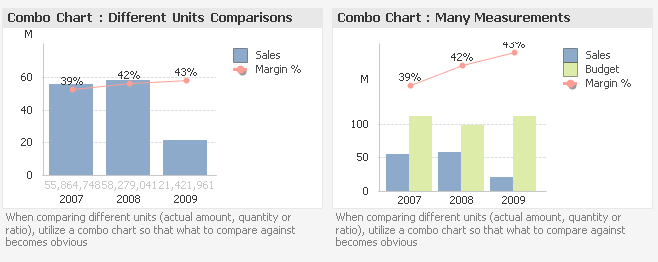
391 Views